
Profile-based optimization techniques in the JVM
An overview of some of the profile-based (optimistic, speculative) optimizations performed by the JVM.


Tuning the performance of Java applications is not always trivial. Even a seemingly simple program can work differently under the hood than we might expect it when we just skim its code. While it's not necessarily a life-saver in everyday coding, it's worth knowing the optimizations performed by the JVM when it comes to performance optimization.
The JVM uses deferred compiling. While javac merely translates Java to Bytecode with minimal optimizations, the JVM does the real compilation Just In Time (JIT) to produce performant native code. The benefit of this approach is that the compilation step has more information about where and how the code is executed. For example, while the program is platform-independent, it can be compiled to the exact architecture where the application is running to take advantage of specific OS or hardware features.
An even more interesting feat is that the JVM collects usage statistics of the application. It tracks what kind of parameters are passed to each method, or which parts of the code are utilized the most. Based on this data, a number of further optimizations are possible, making the program even more performant.
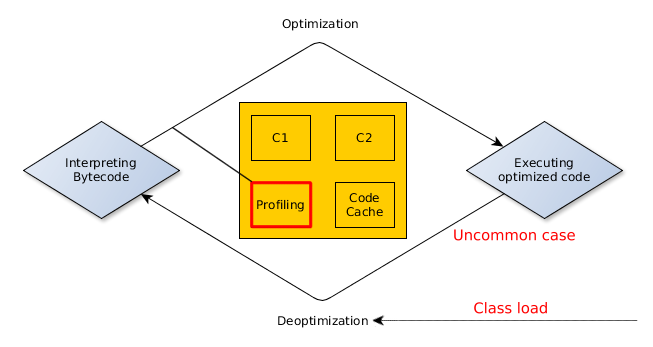
These profile-based optimizations are called optimistic or speculative techniques because rather than mathematical proofs, they are based on the runtime characteristics of the application. For example, the JVM might assume that code in a branch is never going to execute because so far the condition has always been evaluated to false. In this case, it might safely remove the unused branch.
If the runtime behavior changes dramatically, for example, by supplying unusual input, some optimizations made by the JVM may cause problems. If the condition in the example above ever becomes true the optimized code would not work as expected, so the code has to be deoptimized before continuing. Later, the compiler might attempt to optimize the related code again, taking the new information into account.
To get some idea about what profile-based optimizations are supported by the JVM, check this wiki page and these posts.
Last year I crafted several small programs to trigger and measure certain optimizations, but I only got so far to create test cases for optimizations that do not depend on statistical data. While those can make huge performance boost as well, it's not a specialty of the JIT compilers, many of those optimizations can be performed beforehand by many modern Ahead-of-Time (AOT) compilers, so I decided to do some experiments with the optimistic optimizations as well.

In the test cases I aimed to
- write code that intended to trigger (at least) one specific optimization technique,
- test the performance,
- continue testing while injecting unusual circumstances, and see how the JVM reacts.
The measurements were done with JMH (Java Microbenchmark Harness), a library that aids building and running microbenchmarks. The exact numbers in this post are just for illustration purposes, the measurements were made on simple code snippets, not on real productions systems. Contents of this post are mostly based on my observations and the linked resource I could find.
The code of the performance tests are available on Github.
Inlining - the mother of all optimizations
Inlining can eliminate the overhead of a method call by substituting the call (the call site) with the body of the method. More importantly, inlining makes additional optimizations possible, by moving code together and removing method boundaries.
Because of inlining increases code size, it has to be applied carefully. The compiled code is stored in the Code Cache, which is a special heap with a finite size. If it runs out of space, no further code can be compiled. The cost of the inlining depends on the size of the inlined method and the number of call sites that are inlined. So blindly inlining everything is not an option because large functions could bloat the callers. Many classic compilers can inline methods and functions, but the JIT can do it more aggressively, thanks to its access to runtime data that highlights the call sites worth inlining.
The JVM uses multiple heuristics to determine if a method should be inlined or not. For example, it tries to inline trivial methods, like getters and setters as well as frequently called methods to a certain size limit.
The exact parameters of the inlining policy can be changed via runtime arguments, but I'd advise against it. The defaults are tuned for optimal performance by JDK engineers, so except for a few really special cases, it's unlikely that somebody will come up with any better.
Instead, if you suspect that there is an inlining related issue in a critical code path, just enable the following command line flags, to see what the JVM does under the hood.
- -XX:+PrintCompilation
- -XX:+UnlockDiagnosticVMOptions
- -XX:+PrintInlining
(Looking at the diagnostic log of a larger application can be disturbing, but there are tools to visualize it, such as jitwatch. Here is an excellent presentation about it.)
In the following example, some calculations are required for every user interaction. Every user enters two integers, and the calculation just adds them and reports the result back to the user. However, when the second number is zero, a special error handling logic is executed.
int doSomeCalculation(int a, int b) {
        if (b == 0) {
                ...
                // long and complicated error handling
                ...
                return 1;
        } else {
                return a + b;
        }
}
Measuring the application with inputs evenly distributed between 0 and 50000 reveals that it can only serve 10,900,000 calculations per second on average. Running the application with the diagnostic parameters reveals that the JVM can't inline the doSomeCalculation method to its caller because it's too big:
@ 13 org.sample.FirstExample::doSomeCalculation (13870 bytes) hot method too bigThis is a problem because this method is executed for every single user request. Moving the edge case handling logic to a separate method allows the JIT to inline the call, significantly improving the performance.
int doSomeCalculation(int a, int b) {
    if (b == 0) {
        return handleEdgeCase();
    } else {
        return a + b;
    }
}

int handleEdgeCase() {
        ...
        // long and complicated error handling with many other calls
        ...
        return 1;
}
This is a rare case where improving performance also improves readability.
Investigating the diagnostic output shows that the doSomeCalculation method is now inlined, but the JVM could not do anything with the complicated handleEdgeCase. That seems OK for now because the edge case handling only affects a small portion of the user requests.
@ 13   org.sample.FirstExample::doSomeCalculation (13 bytes)   inline (hot)
@ 5    org.sample.FirstExample::handleEdgeCase (13862 bytes)   hot method too big
Running the microbenchmark again reveals that the new throughput is 2,256,900,000 calculation per second. (This extreme difference in performance is largely due to the simple "business logic", the gain would be proportionally smaller if it were more complex.)
Watching the diagnostic logs it seems that the JVM usually undoes the inlining whenever the inlined code has to be deoptimized, but I couldn't measure temporary regression in performance. In this case, I've changed the test to pass only positive integers in the first few minutes, then call the method with numbers from 0 to 50000 as before. When the method was called with the first zero parameter, it had to be temporarily deoptimized because the JVM optimistically eliminated the error handling branch (it was a victim of an optimization called untaken branch pruning - more on that later).
Monomorphic, Bimorphic, N-morphic inlining
Inlining gets tricky when polymorphism is involved because the call site might refer to different methods depending on the type of the receiver object.
Consider for example that the previous calculation has multiple implementations:
interface Calculator {
        int doSomeCalculation(int a, int b);
}

class SimpleCalculator implements Calculator {
        public int doSomeCalculation(int startValue, int step) {
              return startValue + step;
        }
}

// and some more Calculator implementations
Inlining the following hot calculator.doSomeCalculation(a,b) call would be beneficial.
public void handleRequest(Calculator calculator, int a, int b) {
        int result = calculator.doSomeCalculation(a, b);
        // Do something with the result.
}
Luckily the JVM collects type profiles for the polymorphic call sites, and given enough time, it will try to figure out how it can inline them effectively.
When the handleRequest is called with only one type of a calculator, then the call site is monomorphic, so it can be easily inlined.
@ 42   org.sample.NMorphicInlinig::handleRequest (9 bytes)   inline (hot)
  @ 3   org.sample.NMorphicInlinig$MarvelousCalculator::doSomeCalculation (4 bytes)   inline (hot)
The JVM can detect and inline bimorphic cases as well, making the code contain a type check to determine which inlined code should be executed.
@ 42   org.sample.NMorphicInlinig::handleRequest (9 bytes)   inline (hot)
  @ 3   org.sample.NMorphicInlinig$MarvelousCalculator::doSomeCalculation (4 bytes)   inline (hot)
  @ 3   org.sample.NMorphicInlinig$SimpleCalculator::doSomeCalculation (4 bytes)   inline (hot)
   \-> TypeProfile (321335/642671 counts) = org/sample/NMorphicInlinig$SimpleCalculator
   \-> TypeProfile (321336/642671 counts) = org/sample/NMorphicInlinig$MarvelousCalculator
When more than two types are occurring regularly in the call site, the JVM does not inline it.
@ 42 org.sample.NMorphicInlinig::handleRequest (9 bytes)
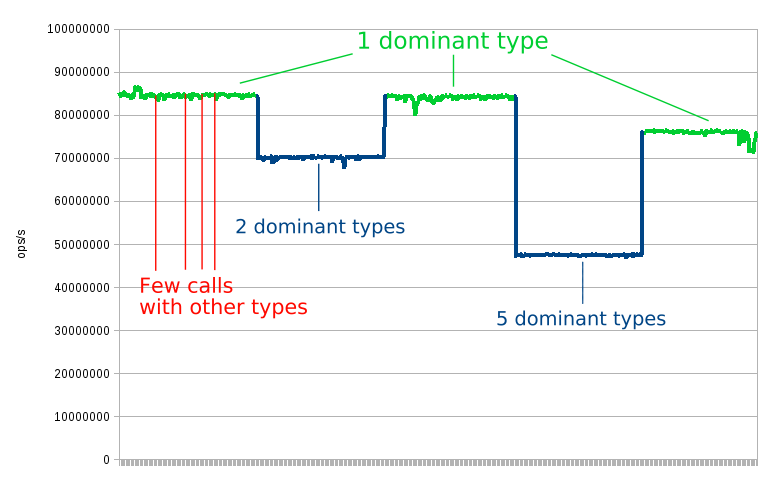
@ 3 org.sample.NMorphicInlinig$Calculator::doSomeCalculation (0 bytes) not inlineableI was hoping that I can see some optimistic inlining when the call site is dominated by one type but occasionally members of 2 other types are passed as well.
Shortly after the startup, the JVM inlines the method, because it has seen only one type so far.
@ 3   org.sample.NMorphicInlinig$MagnificentCalculator::doSomeCalculation (4 bytes)   inline (hot)
   \-> TypeProfile (13236/13236 counts) = org/sample/NMorphicInlinig$MagnificentCalculator
But after supplying a new type, it quickly deoptimizes.
@ 17   org.sample.NMorphicInlinig::testMethod (27 bytes)   force inline by CompileOracle
  @ 2   org.sample.NMorphicInlinig::getCalculator (49 bytes)   callee is too large
  @ 19   org.sample.NMorphicInlinig::handleRequest (9 bytes)
    @ 3   org.sample.NMorphicInlinig$Calculator::doSomeCalculation (0 bytes)   not inlineable
After a while it concludes that it's a bimorphic call site, so optimizes it accordingly.
@ 19   org.sample.NMorphicInlinig::handleRequest (9 bytes)   inline (hot)
   @ 3   org.sample.NMorphicInlinig$MagnificentCalculator::doSomeCalculation (4 bytes)   inline (hot)
   @ 3   org.sample.NMorphicInlinig$SimpleCalculator::doSomeCalculation (4 bytes)   inline (hot)
    \-> TypeProfile (1/791011 counts) = org/sample/NMorphicInlinig$SimpleCalculator
    \-> TypeProfile (791010/791011 counts) = org/sample/NMorphicInlinig$MagnificentCalculator
But soon after, another yet unseen type is supplied, so the code is deoptimized.
17   org.sample.NMorphicInlinig::testMethod (27 bytes)   force inline by CompileOracle
@ 2   org.sample.NMorphicInlinig::getCalculator (49 bytes)   callee is too large
@ 19   org.sample.NMorphicInlinig::handleRequest (9 bytes)
  @ 3   org.sample.NMorphicInlinig$Calculator::doSomeCalculation (0 bytes)   not inlineable
After the JVM determines that the call site is dominated by one type, the inlining happens again.
@ 19   org.sample.NMorphicInlinig::handleRequest (9 bytes)   inline (hot)
  @ 3   org.sample.NMorphicInlinig$MagnificentCalculator::doSomeCalculation (4 bytes)   inline (hot)
   \-> TypeProfile (825826/825828 counts) = org/sample/NMorphicInlinig$MagnificentCalculator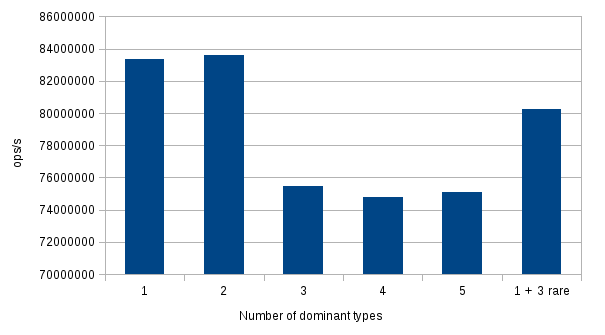
The inlined code is prepared to handle the known rare types, but it's optimized to handle the dominant one, possibly by inlining the most frequent case.
So, to summarize so far the JVM optimizes based on the concrete types supplied as arguments. If only one type of an object is supplied to a method at a call site, it will be specialized to handle that case.
At this point I got curious, what happens if I drastically change the input:
- Supply two different calculators the same proportion for a while.
- Then supply 5 different calculators the same proportion for a while.
- Then revert back to the starting case, by supplying calculators from a single type.
The first two cases worked out as I expected. After the first change, the code was reoptimized to handle the bimorphic call site. When I increased the number of types to 5, the doSomeCalculation method was marked as not inlineable as the call site became megamorphic.
But after the third change, the JVM behaved interestingly. Looking solely at the diagnostic logs it did not inline the method call again. I tried to run the test for a while to give some time for the type profiles to accommodate, but the inlining still did not happen. It seems that the JVM concluded that the call site is megamorphic after the second change, and did not dare to poke it further.
To avoid issues with branch prediction (more on that later), I measured the performance after each experiment by calling the method with a single type again. The chart shows, that the monomorphic and bimorphic call site was inlined as expected, and had the better performance than the megamorphic call site.
Branch prediction and Untaken branch pruning
In general, a CPU has to do many things when it tries to execute an instruction: decode it, fetch the associated data, process the instruction, and write the results. A modern processor has separate hardware for these stages, so one instruction does not have to wait for the previous one to fully finish, they can execute in parallel. For example, as soon as an instruction is decoded, the decoding of the next one can start immediately, there is no need to wait for the previous instruction to finish completely. This technique is called instruction pipelining.
However, when the execution gets to a branch, the next instruction is decided by the result of the preceding one, so this parallelism can not work. What happens is that the CPU tries to guess which branch will be taken, and executes instructions accordingly. If it guessed correctly, then there is no performance hit, but if it's wrong, the pipeline has to be flushed, wasting the previous effort and starting over with new instructions. (For an example, check this Stack Overflow thread to find out why is it faster to process a sorted array than an unsorted one.)
The JVM monitors the branch execution frequencies in the code and tries to compile it accordingly, to minimize the overhead of the branching, taking the characteristics of different hardware into account. I was thinking that it might add some hints to the generated machine code to aid branch prediction, but this mail thread found in this Stack Overflow answer indicates otherwise.
So, the following experiment is to measure optimizations by both the JVM and modern hardware. The following code does something when the given number is greater or equals to zero. It's is already warmed up, both branches are taken at least a few thousand times.
public void isNonNegative(int i) {
        if (i >= 0) {
                // Do something.
        } else {
                // Do something else.
        }
}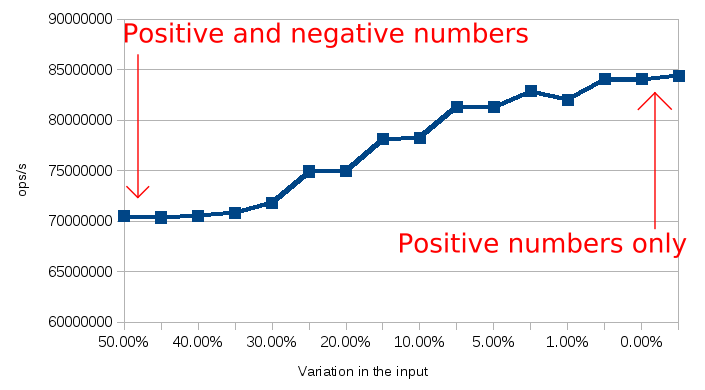
As it can be seen on the chart above, the more predictable which branch will be taken, the better it can be optimized. The system quickly follows the changes in the trends, for example, changing from only positive numbers to only negative barely impacts the average performance.
On top of that, the JVM can detect if a branch is never taken, and in that case, it can omit it from the compiled code to reduce its size and help improve other optimizations. The compiled code contains an uncommon trap for the event of the pruned branch would be necessary. When such trap is hit, it triggers the JVM to deoptimize the code.
Optimistic nullness assertions
A common class of errors is the null pointer dereference. Trying to read the value of a null pointer causes a segmentation fault. In general, processes can handle this, or allow the OS to handle it for them, which usually results in the termination of the process.
The abnormal termination is usually not desirable, so the JVM is generously turning these signals into NullPointerExceptions. So, even if we are not explicitly checking for it, the following code is handling the case when the input String is null, and if that so, it throws an exception.
public String mix(String s) {
        // if s is null then throw a NullPointerException
        return s.toLowerCase() + s.toUpperCase();
}
The implicit null-checking has a cost, but the JVM can optimistically omit it if the collected runtime profile shows that no nulls are passed to this method. The following diagram illustrates what happens to the performance characteristic of the sample program after deliberately injecting a few nulls.
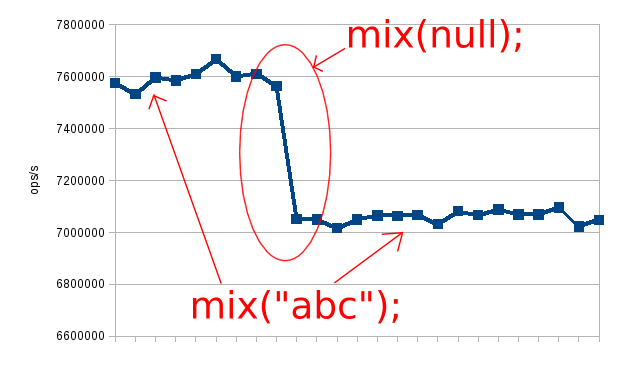
The chart above illustrate what happens to the performance profile when we pass a null to a method that is generally called with non-null values.
The first time the mix method was called with a null, there was no explicit check in place because the JVM optimistically removed it after the first few thousand calls. Dereferencing that null pointer caused a segmentation fault in the compiled native code. It was expected and handled by the JVM to recover, optimize the code, and to throw a java.lang.NullPointerException. For more info about the JVM signal handling, check this guide.
Summary
It was exciting to poke the JVM and watch various optimizations altering the performance characteristics of the test programs.
I've learned some important lessons along the way from these experiments.
The first is that there is a huge gap between the code you write and the code that will execute. It's always worth to measure before and after optimizing something, and we should not solely rely on our instincts, especially when we just look the static code structure for example on a code review. Knowing the potential gain in performance might help to justify the required additional effort and code complexity.
However, measuring performance with microbenchmarks can be challenging. I've done it a couple of times, yet I vastly underestimated the effort required for this post. There is an article with some guiding principles about this topic, I recommend everyone who wants to write microbenchmarks to read it.
In real scenarios, where the network, database etc. comes into play the factors measured in this post count, but there are much more going on. Make sure to not only measure performance at the micro level but throughout the whole application, in production-like settings. I like to think to microbenchmarks as low-level units test with fuzzy results. It's good if they indicate good performance, but the end-to-end performance still needs to be tested.