
JVM JIT optimization techniques
An overview of JVM JIT optimization techniques and fun with measurements.


There's a lot of buzz about JVM optimizations and how it makes production code perform better thanks to the Just-In-Time (JIT) compilation and various optimization techniques. A lots of excellent research materials are available, but I wanted to see for myself how these apply in practice, so I decided to dig deeper and play around with some measurements.
There can be differences between different JVM implementations and architectures that the measurements are done.
Different JVM implementations and architectures might yield different results, so in this post I don't intend to give exact measurements, just a bird's-eye view on the possibilities of the platform.
Deferred compilation
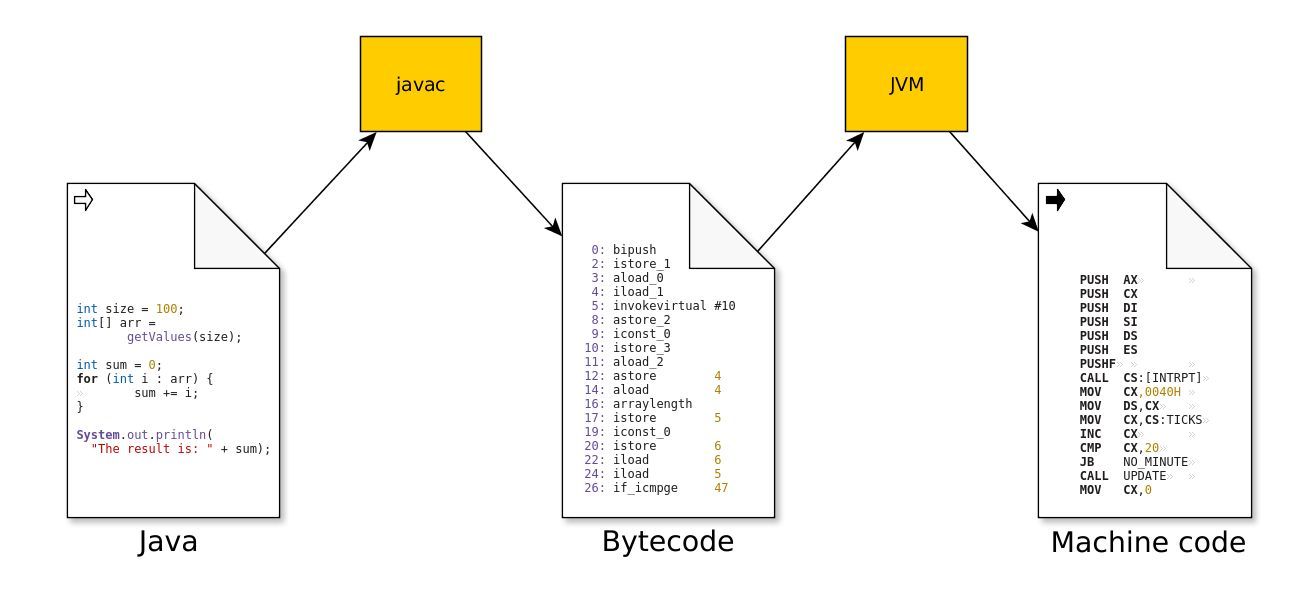
The Java source compiler (javac) reads Java source files and compiles them into class files. Unlike many other compilers, like gcc or ghci it does not produce performant native code for a given target architecture, but it creates bytecode.
The bytecode is composed from a portable instruction set, where all operation codes are represented in a single byte. The instructions are executed on a virtual machine. Thanks to this, the bytecode is architecture agnostic, but it's also a lot less performant in itself than the optimized native code.
The other difference from the compilers mentioned above is that the bytecode compilation does not involve much optimization just a few, like inlining referred constants. (This can bite you if you dare to patch class files directly.)
This means that the produced bytecode resembles the original characteristics of the source code. This similarity opens up the possibility of decompiling applications with ease, and simplifies bytecode manipulation, which is great, for example, if you decide to collect the variable assignments for failing tests.
Early JVM versions did not have any further optimizations, they worked with the bytecode by interpreting the opcodes directly. To make things more performant, HotSpot was introduced in JDK 1.3 to provide Just-In-Time compilation, enabling the runtime to execute optimized code rather than slowly interpreting bytecode instructions.
The JVM takes the time to carefully watch the code as it executes on the virtual machine. For example it analyses what parts of the code are executed often to decide what is worth the optimization, and it also analyses how the code is executed to decide what optimizations can be applied.
The JIT Compiler produces optimized code tailored to the target architecture that replaces the interpreted version on the fly. The compilation happens on a background thread, so it doesn't really interrupt the program execution.
Some optimizations require a more detailed profile, some of them not, so some optimizations can be applied earlier than others, and some of them only worth the effort if the application will run for a long time.
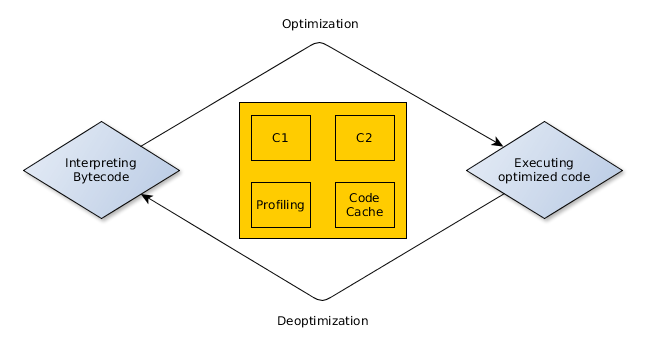
There are two compilers in the JVM: the client (c1) and the server (c2) compiler.
The client compiler performs simpler optimizations, so it requires less time to analyse the running code. It's best used for relatively short running client applications, providing faster startup, but less optimization. The server compiler targets applications that run for a long time, collects more data for profiling. It starts slower, but offers more advanced optimization techniques.
With Java 6, one had to choose between c1 and c2 compilers. From Java 7, there is an option to use Tiered compilation, and from Java 8 this is the default behaviour of the JVM. This approach uses both the c1 and the c2 compilers.
The VM uses the interpreter to execute the code (without optimizations) immediately after starting and profiles it, to decide what optimizations to apply. It keeps track of the number of invocations for each method, and if it exceeds the threshold of the c1 compiler, it makes the method eligible for optimizations by the c1 compiler, so it's queues the method for compilation. Similarly for the c2, if the number of invocations reaches a certain threshold, eventually it will be compiled by it.
The optimizations can be applied at loop back edges too. The VM counts how many times a loop completes an execution, and similarly for the number of method invocations, it queues the loop body for compilation after a number of executions. This technique is called On Stack Replacement (OSR), and it allows the VM to switch between different implementations (interpreted or optimized) of the running code.
Many optimizations are based on educated guesses shaped by previously collected runtime data. Later, if a new information come up that proves such an assumption to be wrong, the VM deoptimizes the related code to prevent incorrect behaviour. The JVM verifies the assumptions made for optimizations with uncommon traps. This triggers VM to fall back to interpreted mode, and recompile the affected code without the incorrect assumption.
The compiled, optimized code is stored in a special heap, called the Code Cache. It is stored there until the related class is unloaded or while the code is not deoptimized. The code cache has a finite size, so if it runs out of space no further code can be compiled, which can cause performance problems. In my experience it rarely happens even for larger applications, but if the default proves to be too small for your app, or you deliberately shrink the Code Cache size, the JVM starts to complain about it:
Java HotSpot(TM) 64-Bit Server VM warning: CodeCache is full. Compiler has been disabled.
Java HotSpot(TM) 64-Bit Server VM warning: Try increasing the code cache size using -XX:ReservedCodeCacheSize=
CodeCache: size=3072Kb used=2528Kb max_used=2536Kb free=544Kb
 bounds [0x00007f12efae5000, 0x00007f12efde5000, 0x00007f12efde5000]
 total_blobs=989 nmethods=629 adapters=272
 compilation: disabled (not enough contiguous free space left)
So, to quickly summarize, JVM defers the compilation to the point where more information is available about the target architecture and the dynamic behaviour of the code. Contrasting with the static Ahead-Of-Time compilation, the dynamic Just-In-Time compilation
- makes optimizations possible that take runtime informations and statistics into account
- with the price that the application has slower startup time, and reaches it's peak performance later,
- and you don't have to compile your code to many different platforms by yourself, it will be done by the VM.
Optimization Playground
After the lengthy intro about optimizations in JVM lets have some fun with the different techniques that JVM provides.
First, I'd like to point out that my measurements are only to highlight what's possible in the JVM, and not to produce exact numbers. Some optimizations can be easily measured, while others are not. Some measurements might be distorted by other optimizations that I did not take into account, or by some clever JVM strategy that provides graceful degradation if some techniques are not fully available. Moreover, optimizations typically work together, and in reality, they serve larger applications, not by tweaked microbenchmarks like the ones I've created.
Finally, there are many optimizations in the JVM, and they are deep under the hood. They are not always that well documented, and may vary from JVM to JVM.
So, below are a non-exhaustive list of optimizations with measurements I adjusted in the hope to trigger a specific optimization.
The measurements are done with JMH (Java Microbenchmark Harness), a library that aids building and running various benchmarks correctly.
Inlining
Inlining eliminates the cost of the method calls by substituting a method call with the body of called method. Moving related code together also enables further optimizations, that would be impossible for separate methods, like Subexpression Elimination or Heap Allocation Elimination.
Of course, it would be impractical to inline everything. By default it works on methods where the compiled size is less than 35 bytes, or for hot methods smaller than 325 bytes. (This thresholds can be changed via the -XX:MaxInlineSize and -XX:FreqInlineSize parameters.)
For example, in the following example the add method will be inlined eventually:
public void inliningExample() {
	int sum = add(100, 2000);
	// Do something with sum.
}

public static int add(int a, int b) {
	return a + b;
}
The size limit takes assertion statements into account, even if they are disabled. (Which is the case by default.)
I've ran a series of experiments where I measured the performance of the inliningExample method with bigger and bigger add methods. (I made the method bigger by adding simple assert expressions.)
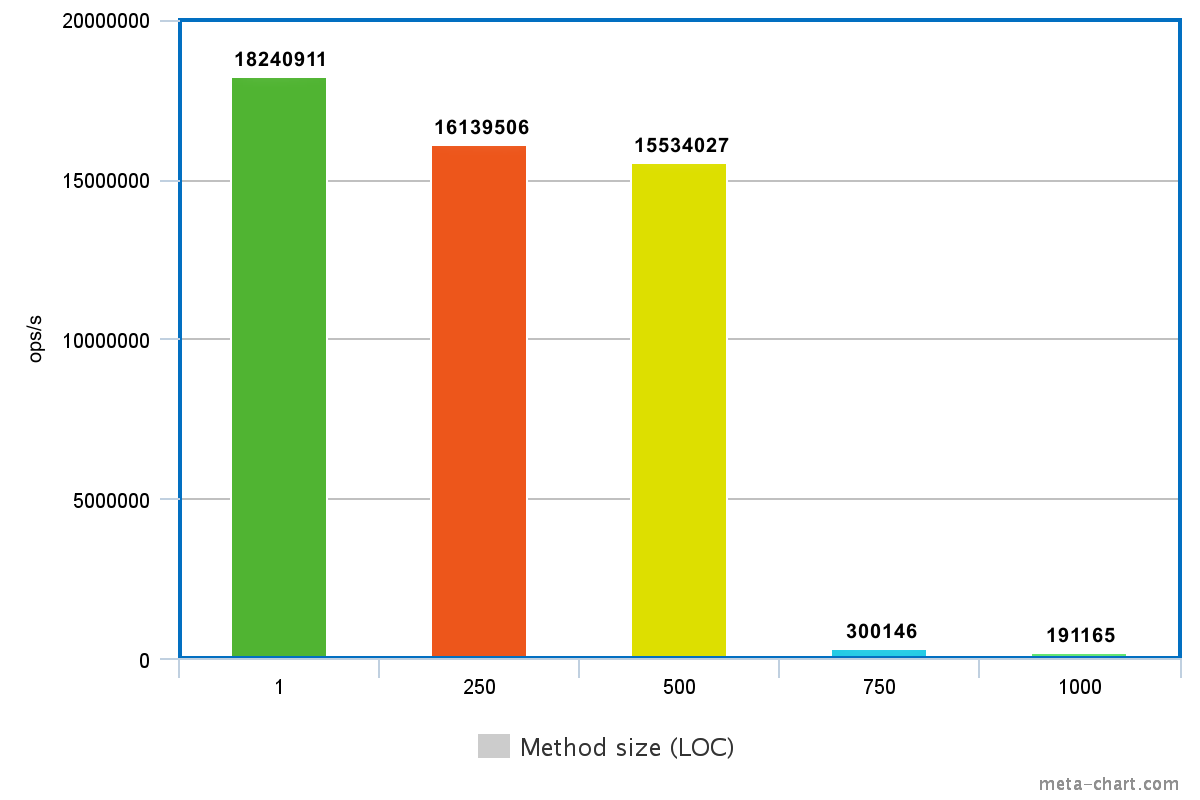
The figure above clearly shows a break in performance after a certain method size.
Inlining is also bound by polymorphism. When dispatching a method call, the JVM checks how many different implementations of that method has.
- If there is only one, then it is a monomorphic dispatch,
- if there are two implementations, then it's called bimorphic dispatch,
- and if there are more than two implementations that can receive the method call, then it's called megamorphic dispatch.
Monomorphic and bimorphic method calls can be inlined, while megamorphic calls can not.
I ran a second experiment to verify this.
public abstract interface Animal { public String say();}
public class Dog implements Animal {public String say() {return "bark";}}
public class Cat implements Animal {public String say() {return "meow";}}
public class Octopus implements Animal {public String say() {return "...";}}
// More animals if needed...

public void inlining() {
	Animal a;
	if (i == 0) { // i is a random number from 0 to 2.
		a = new Dog();
	}
	else if (i == 1) {
		a = new Cat();
	}
	else if (i == 2) {
		a = new Octopus();
	}
	else {
		throw new NullPointerException();
	}

	String result = a.say();
	// Do something with the result.
}
I checked it with one, three and five Animal implementations. The code with the monomorphic dispatch was almost twice as fast than the other two.
Escape Analysis, Allocation Elimination, Lock Elision
The scope analysis performed by the JVM to determine if an object is able to escape from the scope of the current method or thread is called the Escape Analysis.
If the object is only used by a single thread, then the locks for this object can be elided, so unnecessary synchronization will not cause performance penalty. If the object stays in the context of one method, its heap allocation can be avoided as well.
Inlining from the previous chapter can help increase the effectiveness of this optimization. If an object is only accessed by a few methods, then inlining those opens the possibility of eliminating its heap allocation.
To see it in action consider the following example. In the code below the synchronized section has no real effect, because the lock can only be accessed by the current thread.
public void lockElision() {
	A a = new A();
	synchronized (a) {
		// Do something meaningful.
	}
}
The JVM recognises this, and removes the lock-related parts from the executed code, so it's as performant as there was no synchronized block at all.
This works for more complex cases too. A legacy codebase might utilize StringBuffers instead of StringBuilders. In a typical scenario, one usually don't need the thread safety provided by the former one, yet it stuck in the code for historical reasons.
Luckily the JVM can optimise the locking in this case for us.
public void testMethod() {
StringBuffer sb = new StringBuffer();
for (int i = 0; i < 1000; i++) {
String s = "adding stuff";
sb.append(s);
}
String result = sb.toString();
// Do something with the result.
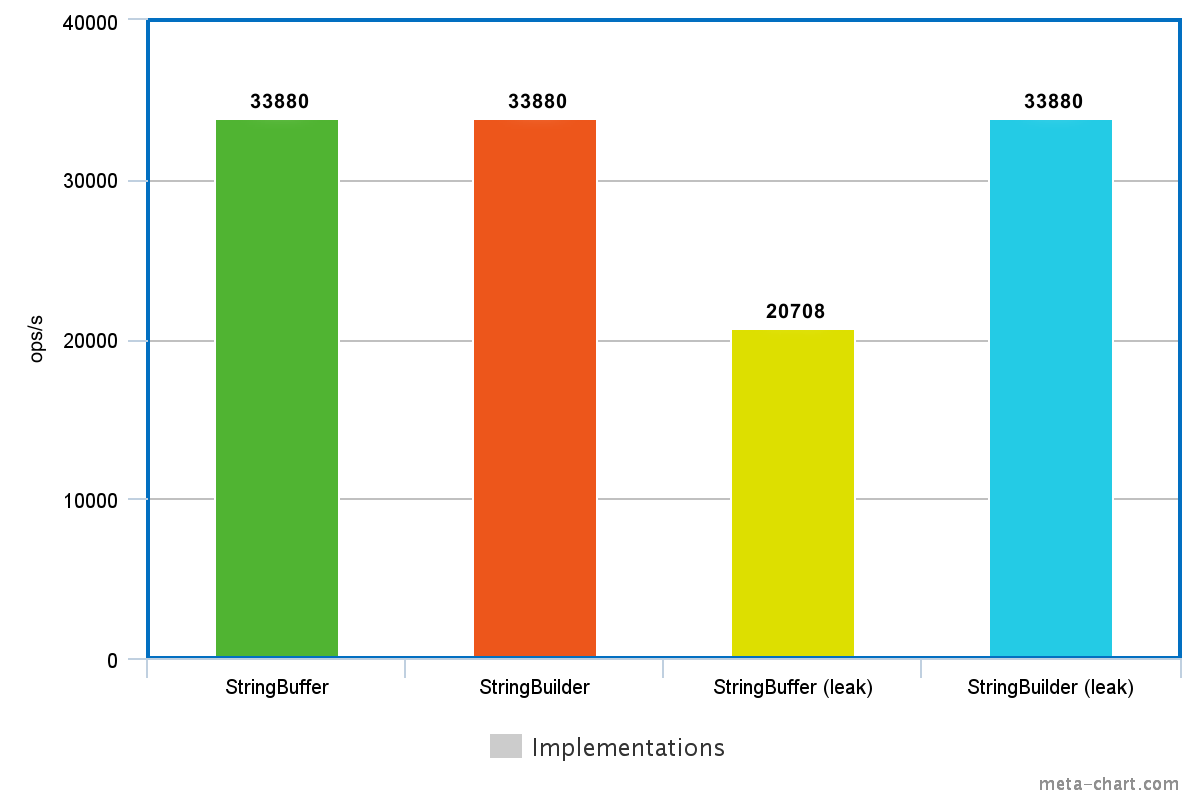
}Measuring the method above and a slightly altered version where sb is a StringBuilder I got almost the same performance characteristics. So if the StringBuffer does not escape this method, it's as performant as a StringBuilder.
However, if I changed them to deliberately leak the sb reference, the version with the StringBuffer got a lot slower, while the one with the StringBuilder performed just as good as before.
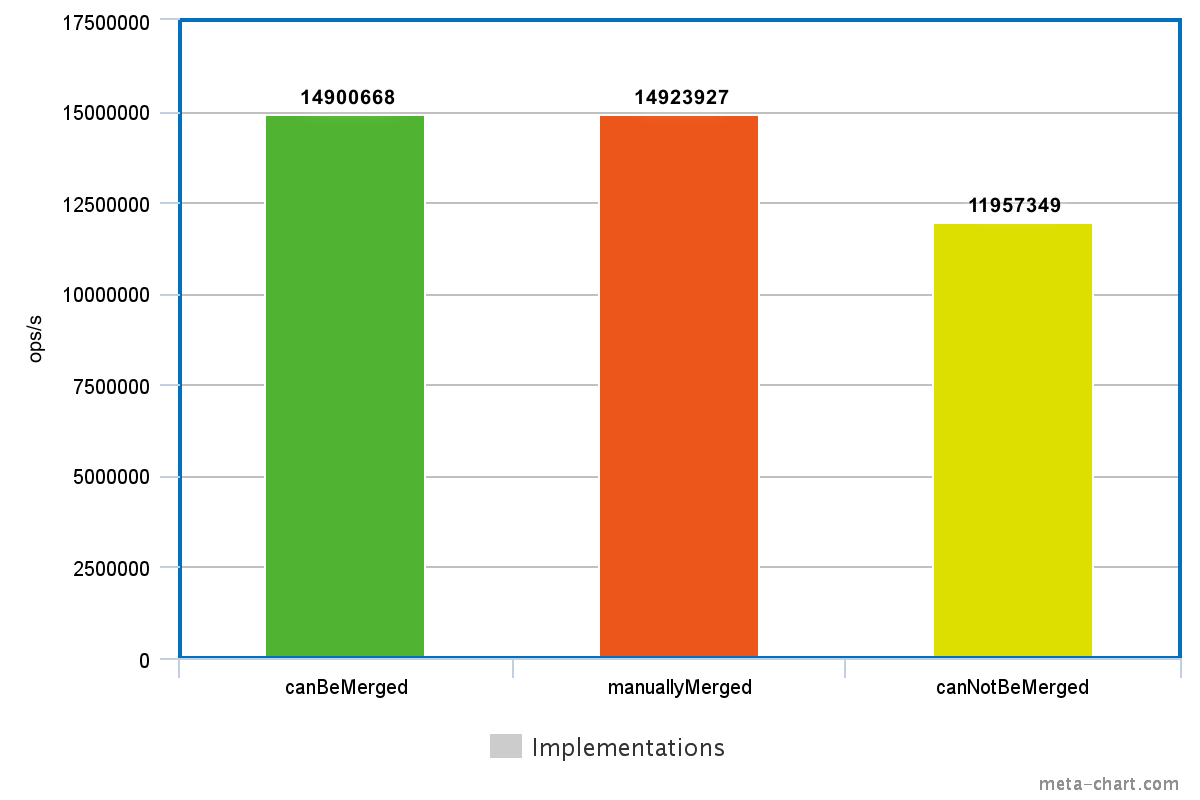
Lock Coarsening
Where Lock Elision is not applicable, Lock Coarsening might kick in to improve the performance. This optimization merges adjacent synchronization blocks where the same lock object is used, thus reducing synchronization overhead.
Consider the following examples:
public void canBeMerged() {
	synchronized (A.class) {
		// Do something 1.
	}

	synchronized (A.class) {
		// Do something 2.
	}

	synchronized (B.class) {
		// Do something 3.
	}
}

public void manuallyMerged() {
	synchronized (A.class) {
		// Do something 1.
		// Do something 2.
	}

	synchronized (B.class) {
		// Do something 3.
	}
}

public void canNotBeMerged() {
	synchronized (A.class) {
		// Do something 1.
	}

	synchronized (B.class) {
		// Do something 2.
	}

	synchronized (A.class) {
		// Do something 3.
	}
}
These examples only differ in the order of the synchronization blocks. In the first example, the first two synchronization block can be merged, because they lock on the same object, so performance-wise the first and the second methods are the same. The last of the three methods, however, can not be optimized this way, the three separate blocks must be preserved.
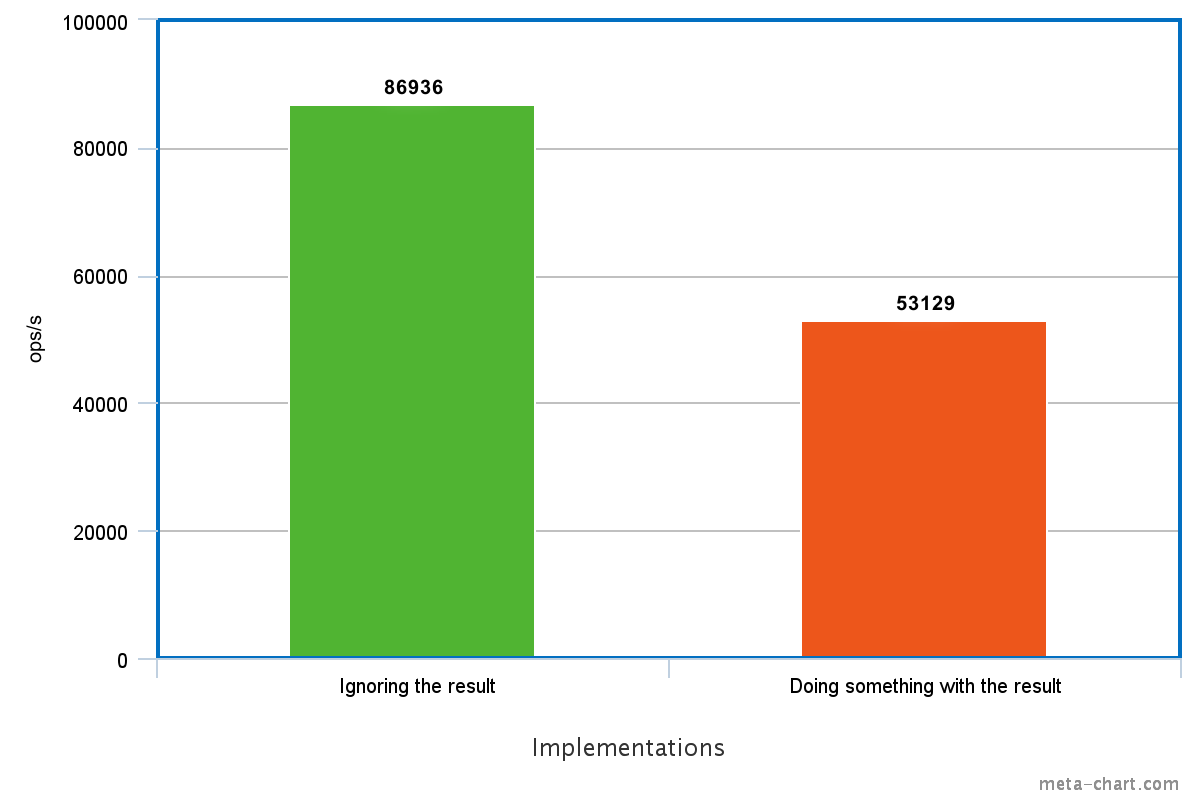
Dead Code Elimination
Dead Code is code that has no effect on the outcome of the program. In many cases, such code can be detected and removed without any noticeable behaviour change, except performance.
Consider the following code:
public void deadCodeElim() {
	int size = 20000;
	int[] values = createValues(size);

	int result = 0;
	for (int value : values) {
		result += value;
	}

	// We don't do anything with the result
}

public int[] createValues(int size) {
	int[] values = new int[size];
	for (int i = 0; i < values.length; i++) {
		values[i] = i;
	}
	return values;
}
If we forget to do anything with the computed result in the end of the deadCodeElim method, then it's futile to initialize and increment it with every value. But if we don't use the result for anything, then it means that we also don't use the values array for anything, so the call to the createValues method can be skipped as well. Which makes the size variable completely useless. The JVM removes all these unnecessary code as part of this optimization making the implementation much faster.
Summary
JVM is a brilliant piece of software that makes your code run faster without having to worry about optimizations that might come at the expense of maintainable codebase (e.g. inlining methods in the source code). These optimizations are affected by many factors, so it's not worth optimizing anything before the need for that is well supported by measurements. Gut feelings about code performance can be misleading, because there is a lot more under the hood of the JVM that it seems at first. And exactly this is the great thing about it: for most of the time, many performance considerations are invisible from the higher abstraction levels, so you can concentrate writing simple, elegant and maintainable applications in Java, Scala, Kotlin or anything that runs on the JVM.
If you enjoyed this post, make sure to check out the follow-up with more JVM magic.