
How to integrate with Elastic Stack via Logstash
Collect and transform logs with Logstash


A previous post explored how to integrate a Dockerized application with Elastic Stack using the Elastic Logging Plugin and transform the incoming data with Ingest Pipelines.

Ingest pipelines are built-in to Elasticsearch so getting started with them is really easy. However, compared to Logstash their capabilities are more limited.
This short post is about integrating a Spring Boot application with Elastic Stack using Logstash to receive and process the logs.

Start Elastic Stack with a Logstash node
This time I also started from the compose file provided by Elastic. Similarly to the previous post I use a single Elasticsearch node, but this time Logstash is also part of the mix.
version: '3'

services:
  elasticsearch:
    image: docker.elastic.co/elasticsearch/elasticsearch:7.12.0
    container_name: elasticsearch
    environment:
      - discovery.type=single-node
      - bootstrap.memory_lock=true
      - "ES_JAVA_OPTS=-Xms512m -Xmx512m"
      - ELASTIC_PASSWORD=changeme
      - xpack.security.enabled=true
    volumes:
      - elasticsearch-data:/usr/share/elasticsearch/data
    ports:
      - 9200:9200
    networks:
      - elastic
  logstash:
    image: docker.elastic.co/logstash/logstash:7.12.0
    networks:
      - elastic
    depends_on:
      - elasticsearch
    ports:
      - 5000:5000
    volumes:
      - ./logstash/pipeline:/usr/share/logstash/pipeline
  kibana:
    image: docker.elastic.co/kibana/kibana:7.12.0
    container_name: kibana
    environment:
      - ELASTICSEARCH_USERNAME=elastic
      - ELASTICSEARCH_PASSWORD=changeme
      - ELASTICSEARCH_URL=http://elasticsearch:9200
      - ELASTICSEARCH_HOSTS=http://elasticsearch:9200
    ports:
      - 5601:5601
    depends_on:
      - elasticsearch
    networks:
      - elastic
volumes:
  elasticsearch-data:
    driver: local
networks:
  elastic:
    driver: bridge
Note the volume mounting the logstash/pipeline folder from the host machine which includes the logstash.conf file:
input {
    tcp {
        port  => "5000"
        codec => json_lines
    }
}
output {
    elasticsearch {
        hosts    => ["http://elasticsearch:9200"]
        index    => "myapplication-%{+YYYY.MM.dd}"
        user     => "elastic"
        password => "changeme"
    }
}
The config defines a Logstash pipeline that accepts JSON documents on port 5000 and persists them into an index called "myapplication-<date>".
The name of the index is important because it determines which Index Template to use when the index is created. Among others, an Index Template defines the data structure to be used and it can cause some trouble if they are not properly aligned.
Elasticsearch has built-in index templates like logs-* to handle the data as data streams. Data streams are a recent additions to the Elastic stack, and Logstash 7.12 has no support for them;
it can only
work with simple indexes. So, if the index name would be "log-something", it wouldn't work and most likely it would fail with an error similar to what is reported in this forum thread.
Update: since I started writing this post, Logstash 7.13 got released which can be configured to append data to streams.
The bottom line is that you should always make sure to use an index name that does not match any default Index Template, or make sure it matches a default you like to use.
When the stack is running, Index Templates can be managed in the the Stack Management > Index Management menu where you can check the defaults and also create new ones.
Run docker-compose up and access the Kibana UI at http://localhost:5601.
Next, lets create a simple application to push some logs, so there'll be something to see.
Push log entries from a Spring Boot application
By default, Spring Boot uses Logback for logging which can be fine-tuned by creating a logback-spring.xml configuration:
<?xml version="1.0" encoding="UTF-8"?>
<configuration>
    <include resource="org/springframework/boot/logging/logback/defaults.xml"/>
    <include resource="org/springframework/boot/logging/logback/console-appender.xml"/>

    <appender name="logstashNetworkAppender" class="net.logstash.logback.appender.LogstashTcpSocketAppender">
        <destination>localhost:5000</destination>
        <encoder class="net.logstash.logback.encoder.LogstashEncoder">
        </encoder>
        <keepAliveDuration>5 minutes</keepAliveDuration>
    </appender>

    <root level="INFO">
        <appender-ref ref="logstashNetworkAppender"/>
        <appender-ref ref="CONSOLE"/>
    </root>
</configuration>
This snippet adds the LogstashTcpSocketAppender which sends the log entries in JSON format to the Logstash node and it also keeps using the default Console Appender.
After starting the application, the logs will be visible in Kibana.
Setup the index in Kibana
In order to observe the logs, a few things need to be configured in Elastic stack once some data is already there.
First, an Index pattern have to be set up under Stack Management > Index patterns. Create one with the pattern "myapplication-*" to match all indexes that are created by the Logstash pipeline.
Then go to the Logs page, and under the Settings submenu, add the same index pattern to the comma separated list for the Log indices.
Once it's done, visit the logs in the Discovery or in the Logs page.
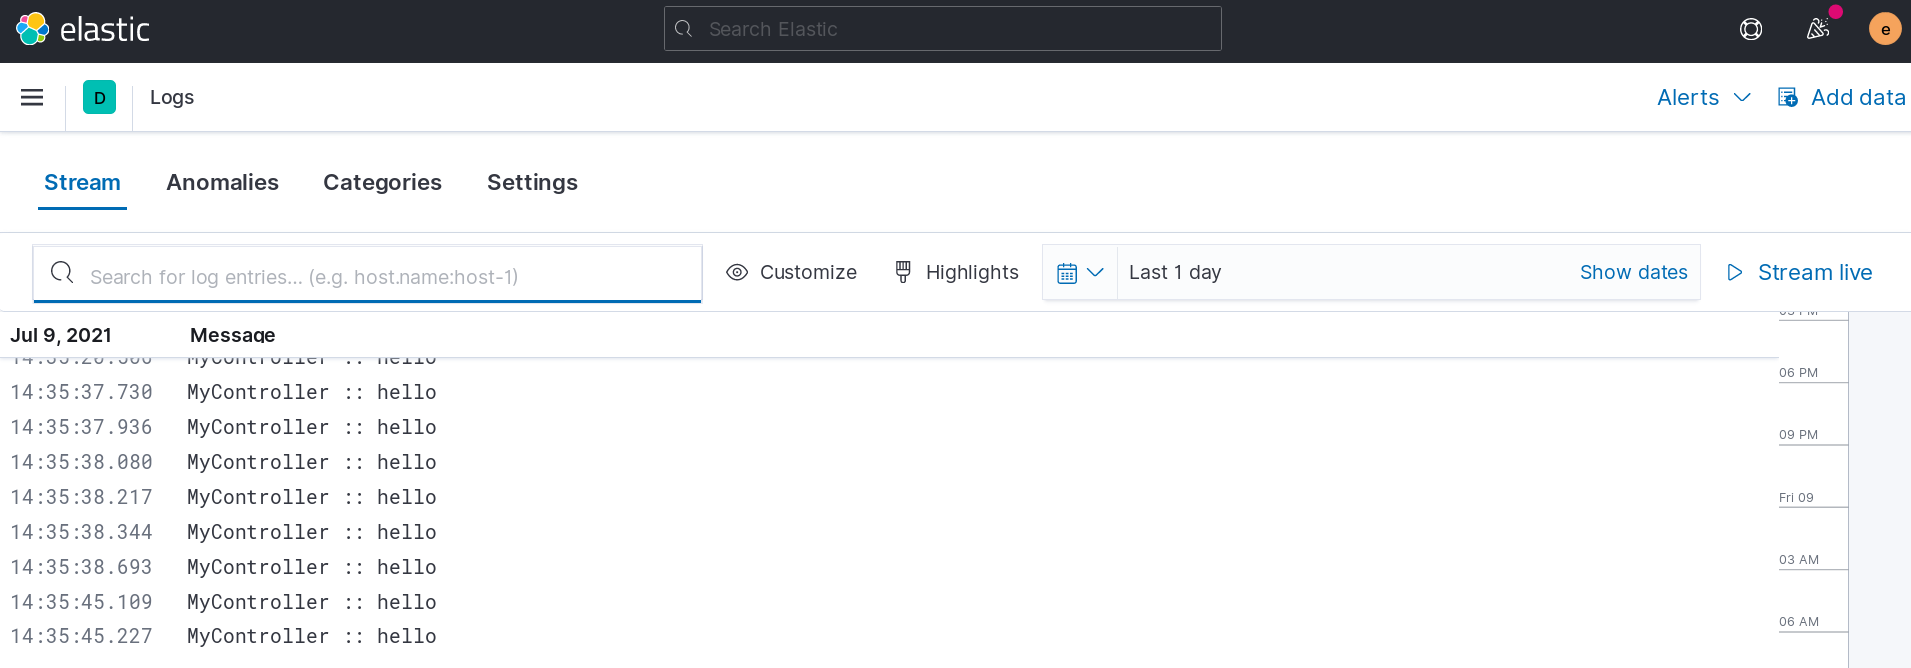
Enrich the data with Logstash
To demonstrate some of the capabilities of Logstash, let's modify the pipeline to do something interesting by adding a filter that creates a new field called message_uppercase by creating a copy of the message field and applying a
mutation to it:
input {
    ...
}
filter {
    mutate {
        add_field => { "message_uppercase" => "%{message}" }
    }
    mutate {
        uppercase => [ "message_uppercase" ]
    }
}
output {
    ...
}
After sending some log entries to this pipeline, the new field can be added in the Logs panel showing the results:

Summary
By the end of this post, you have an Elastic Stack running locally with all 3 components: Elasticsearch, Logstash and Kibana, relying on Logstash to accept log entries in the form of JSON documents.