
How to integrate a containerized application with the Elastic Stack
Use Elastic's log driver to collect the your logs

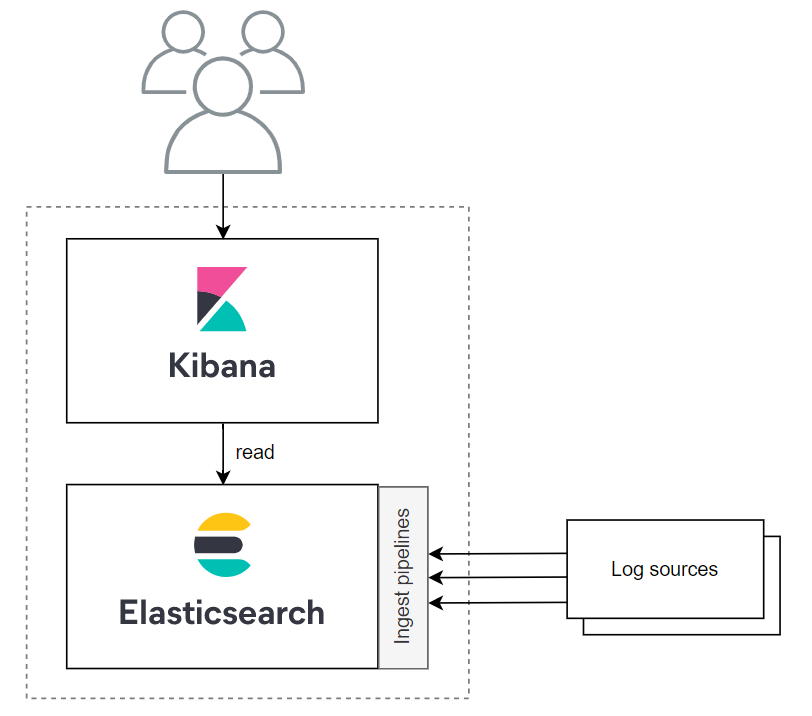
The Elastic Stack (ELK) refers to a cluster of open-source applications applications integrated to form a powerful log management platform. The two central elements are Elasticsearch and Kibana, the former one responsible for providing storage and search capabilities for the log entries, while the latter one is used to visualize them.
Logs can be loaded to Elasticsearch in multiple ways. For one, there's Logstash, a server-side data processing pipeline which can collect data from various sources and transform it before stashing it. Another alternative, which I'll use in this post, is to use lightweight data shippers called Beats to send data directly to Elasticsearch and transform it there using Ingest pipelines.
In this post I'll use a containerized Spring Boot application with the Elastic Logging Plugin log driver as a log source.
Start Elastic Stack
The easiest way to get up and running locally is to use Docker Compose and start from a Compose file provided by Elastic. Based on this I created my own docker-compose.yml file based on the recommendations, but only using a only a single one to make the setup easier.
version: '3'

services:
  elasticsearch:
    image: docker.elastic.co/elasticsearch/elasticsearch:7.12.0
    container_name: elasticsearch
    environment:
      - discovery.type=single-node
      - bootstrap.memory_lock=true
      - "ES_JAVA_OPTS=-Xms512m -Xmx512m"
      - ELASTIC_PASSWORD=changeme
      - xpack.security.enabled=true
    volumes:
      - elasticsearch-data:/usr/share/elasticsearch/data
    ports:
      - 9200:9200
    networks:
      - elastic
  kibana:
    image: docker.elastic.co/kibana/kibana:7.12.0
    container_name: kibana
    environment:
      - ELASTICSEARCH_USERNAME=elastic
      - ELASTICSEARCH_PASSWORD=changeme
      - ELASTICSEARCH_URL=http://elasticsearch:9200
      - ELASTICSEARCH_HOSTS=http://elasticsearch:9200
    ports:
      - 5601:5601
    depends_on:
      - elasticsearch
    networks:
      - elastic
volumes:
  elasticsearch-data:
    driver: local
networks:
  elastic:
    driver: bridge
After the services are started with docker-compose up, the Kibana UI can be accessed at http://localhost:5601 with the credentials defined in the compose file.
There's not much to see because we did not push any logs to it yet.
Create a Spring Boot application
For this demonstration I'll use a Gradle-based Spring Boot Web application that is only capable of serving a hello world message on http://localhost:8080 while creating a log entry:
@Controller
public class LoggerController {
  Logger logger = LogManager.getLogger(LoggerController.class);

  @GetMapping("/")
  @ResponseBody
  public String info() {
      logger.info("This is a sample INFO message");
      return "Hello World!";
  }
}
By default the application presents its logs on its standard output in a human readable way:
2021-05-04 21:21:44.003 INFO 50096 --- [nio-8080-exec-1] h.a.e.elkexample.LoggerController : This is a sample INFO messageFrom the application's point of view we don't need to do anything else, because it will be containerized and the logs will be handled by a Docker log driver.
Containerize the application and integrate it with the Elastic Stack
The application can be containerized in many ways. Probably one of the most convenient methods to build a Docker image for your application is to rely on Buildpacks for which Spring Boot has native support since version 2.3.0.M1.
Let's create the image with the following command:
./gradlew bootBuildImage --imageName=spring-elk-exampleAnd run the application as a container:
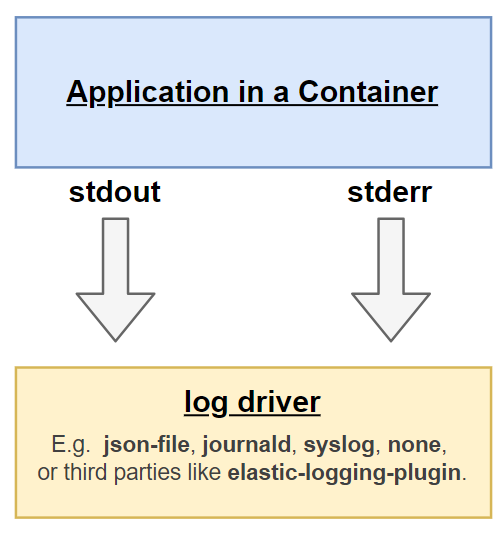
docker run --rm -p 8080:8080 spring-elk-exampleAt this point the log emitted by the Spring application's standard output is stored locally by Docker and can be observed using the
docker logs command. By default Docker uses the json-file logging driver, which caches container logs as JSON internally, but this
can be changed by selecting other logging drivers, like syslog or journald. Recent Docker versions also allow to use third-party
plugins as a logging driver. The Elastic Logging Plugin is a custom log driver for Docker that uses an Eleasticsearch
instance to store the logs.
After installed, it can be specified with the log-driver option:
docker run --rm --log-driver=elastic/elastic-logging-plugin:7.12.0 \
  --log-opt hosts="http://localhost:9200" \
  --log-opt user="elastic" \
  --log-opt password="changeme" \
  -p 8080:8080 \
  spring-elk-example
With this setup log entries of the application are pushed directly to Elasticsearch.
After executing the command above the startup logs should be already visible in Kibana.
Setup an index pattern in Kibana
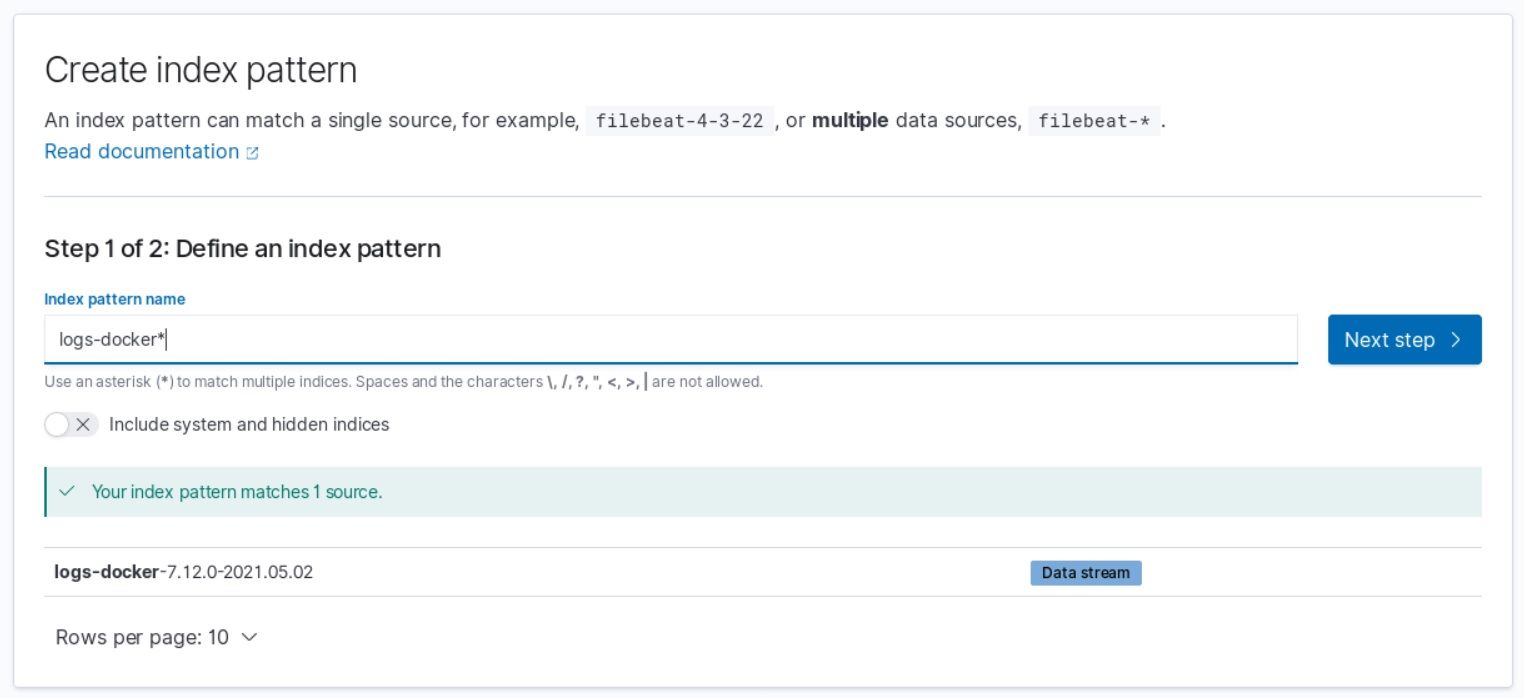
Kibana requires index patterns to access the Elasticsearch data. An index pattern selects the data to use and allows to define properties of the fields.
To create one, go to Stack Management > Index patterns. If the logs were made it to Elasticsearch, you should see a Create index pattern button.
Once it's in place, you can explore the logs in the Logs or in the Discovery panel.
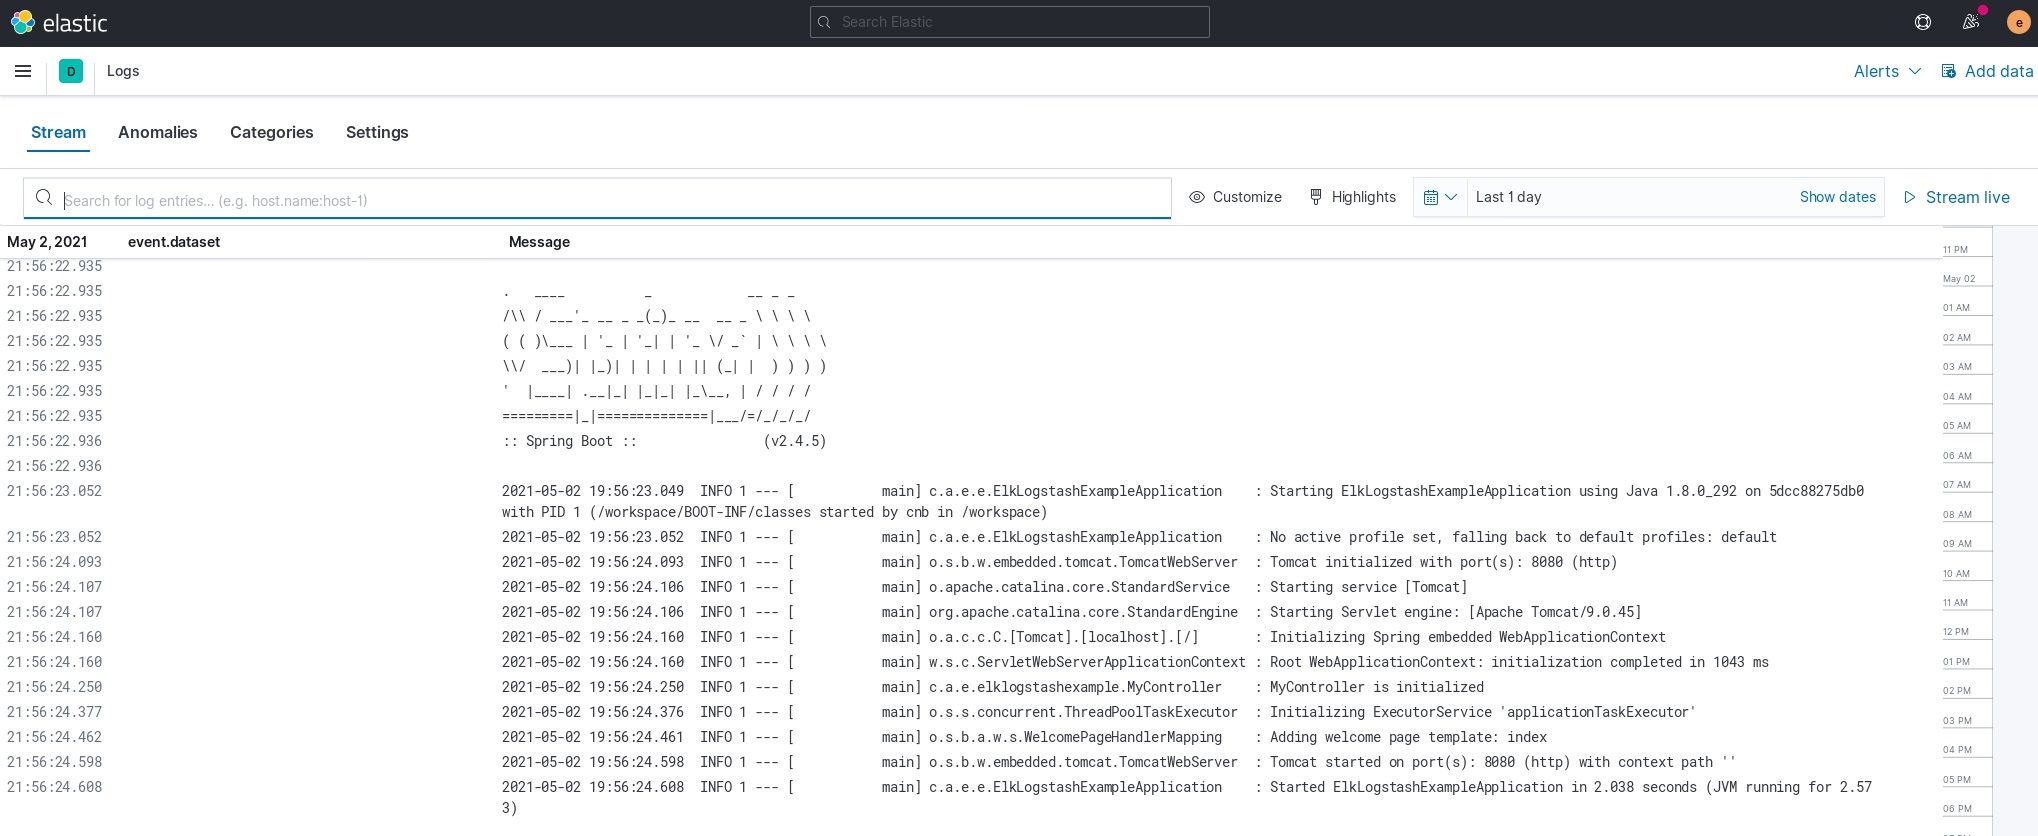
If you have many applications this is already beneficial since you can check all the logs in one place. However, currently the messages are just blocks of unstructured text which makes further filtering and grouping harder.
Troubleshooting integration problems
If you can see the logs in Kibana then you are luckier than I was and can skip this section. For the rest of us, here comes a few debugging tips when seemingly everything is set up correctly, but those pesky logs just don't want to show up.
At first when I started the Spring Boot container, nothing happened: no logs appeared in Kibana and also there were no errors in the ELK stack's own log output.
To find out the cause of the issue I had to check the log output of the docker driver, as it was described in this helpful post:
- First you have to figure out the ID of the Elastic Docker Plugin:
docker plugin inspect elastic/elastic-logging-plugin:7.12.0 | grep "\"Id\"" - Then, you can check the
stdoutandstderroutputs of this plugin:cat < /run/docker/plugins/<Plugin ID>/init-stdout cat < /run/docker/plugins/<Plugin ID>/init-stderr
From the logs it became apparent that by mistake I configured wrong credentials for the log driver.
Later on whenever my logs did not appear in Kibana my first thing was to check the plugin logs, and quite often I found the explanation there.
The second issue I bumped into is that Elasticsearch did not accept new document due to my disk was almost full. The following message appeared in its logs:
flood stage disk watermark [95%] exceeded ...Under normal circumstances I'd recommend having a bunch of free disk space available in case you want to run a log mass-processing service, but in my local environment
I did not care too much. As usual,
Stack Overflow came to the rescue,
revealing the cluster.routing.allocation.disk.watermark.* properties responsible for this particular threshold.
Process the logs
Back to the question about logs being text blobs, there are multiple ways to approach this problem, but all requires some kind of processing on the server side. Processing steps can be defined by creating Ingest pipelines in Elasticsearch, or they can also be defined in Logstash. As I mentioned in the beginning, in the context of this blogpost I decided to stick with the Ingest pipelines, and in this section I present two different usages.
Ingest pipelines can be created via Elasticsearch's REST API or via the UI. For me the latter one was not trivial at first, because I was a bit lost between the so many options available. Fortunately, from the operational point of view, most interesting stuff is under the Stack Management menu: this is where Ingest pipelines can be defined as well.
Each Ingest pipeline has a name that can be specified by the sender of the logs (in this case, the Docker log driver) in case they want the logs to be transformed by it.
Grok log entries in Elasticsearch
The text message of a log entry can be parsed by an ingest pipeline with a Grok processor. According to Wikipedia, the term "grok" was coined by the American writer Robert A. Heinlein, and it roughly means "to understand intuitively". In a nutshell, Grok processors can be configured with regex-like patterns to capture interesting parts of a text content.
To create my pattern I was relying on the Online Grok Pattern Debugger Tool which helped me interactively come up with the proper expression. Otherwise if something is broken in the pipeline, you can see it in the client side, in this case, by investigating the logs of the Docker driver.
After some trial and error I came up with the following pattern to grok the log produced by a default Spring Boot application:
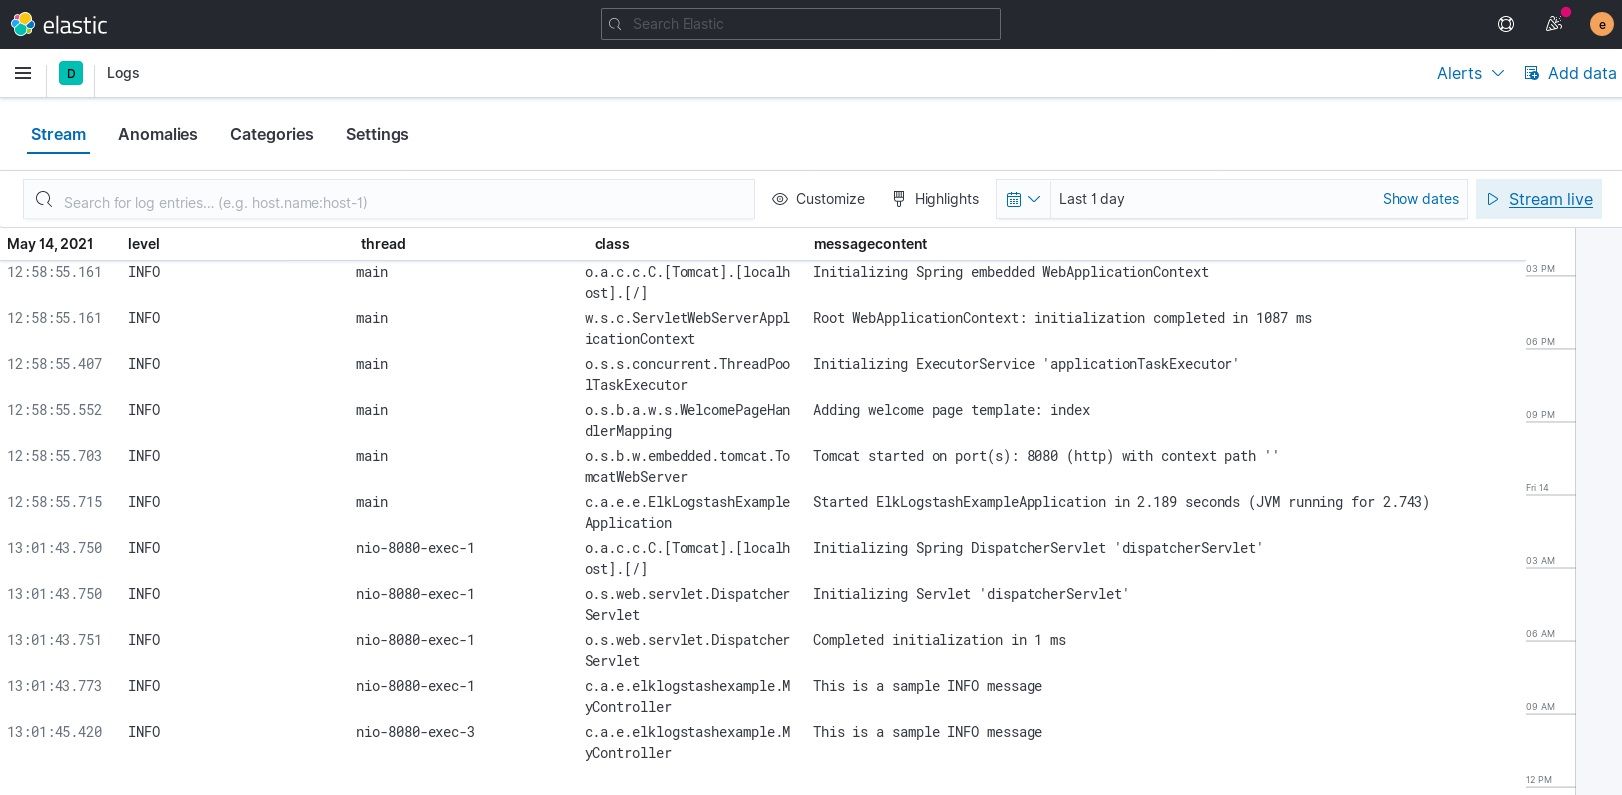
^%{TIMESTAMP_ISO8601:timestamp} +%{DATA:level} +%{NUMBER:pid} +--- +\[ *%{DATA:thread} *\] +%{DATA:class} +: +%{DATA:messagecontent}$Finally, the container has to be started with an extra parameter to tell the log driver to use this pipeline: --log-opt pipeline="parse_spring_log". After this the different parts of the
log entry can be observed individually, opening up the possibility to filter and group entries based on those values.
Produce JSON log entries in the application
Another way to go is to produce log messages that are easier to parse. For this, I used the LogstashEncoder by adding a custom logback-spring.xml configuration to the Spring Boot application:
<?xml version="1.0" encoding="UTF-8"?>
<configuration>
  <appender name="logstashAppender" class="ch.qos.logback.core.ConsoleAppender">
    <encoder class="net.logstash.logback.encoder.LogstashEncoder"/>
  </appender>
  <root level="INFO">
    <appender-ref ref="logstashAppender"/>
  </root>
</configuration>
After this change, the application's log will change and it will emit JSON documents similar to these ones:
{"@timestamp":"2021-05-04T21:21:44.003+02:00","@version":"1","message":"This is a sample INFO message","logger_name":"elklogstashexample.elkexample.MyController","thread_name":"http-nio-8080-exec-1","level":"INFO","level_value":20000}However, by default these messages are still interpreted as blobs of plain text by default. To solve this issue we have to create and use an Ingest pipeline, but this time with a JSON Processor.
Summary
By the end of this post the Spring Boot application and the Elastic Stack is happily dealing with the logs on our local machine, ready to be customized with dashboards and alerting to turn this data into information.