Plotting charts with SVG
This post is about drawing Catmull-Rom splines with SVG

Background
Some time ago I needed to draw a simple chart. I took the hard path not to use any third party library, although there are some with this already implemented, like D3.js. Also I didn't want to use Canvas, as it would have brought it's own problems. Soon I realized that SVG does not support curves that crosses all the control points, making them unsuitable for plotting charts.

Converting Catmull-Rom spline to Bezier curve
There is a spline, called Catmull-Rom, which does cross the control points and provide a nice-looking plot. After some googling, I've found this excellent article. It has a converter that parses the SVG path d attribute for a special curve, labelled R and converts it's control points to Bezier curve and replaces the path. It is exactly what I wanted, but I more like that each stuff do one thing, so I've separated his code into more reusable parts.
The converter method
The soul of this is the converter. It gets a couple of points and return the control points for the Bezier curve.
function catmullRom2bezier(points) {
    var result = [];
    for (var i = 0; i < points.length - 1; i++) {
        var p = [];

        p.push({
            x: points[Math.max(i - 1, 0)].x,
            y: points[Math.max(i - 1, 0)].y
        });
        p.push({
            x: points[i].x,
            y: points[i].y
        });
        p.push({
            x: points[i + 1].x,
            y: points[i + 1].y
        });
        p.push({
            x: points[Math.min(i + 2, points.length - 1)].x,
            y: points[Math.min(i + 2, points.length - 1)].y
        });

        // Catmull-Rom to Cubic Bezier conversion matrix
        //    0       1       0       0
        //  -1/6      1      1/6      0
        //    0      1/6      1     -1/6
        //    0       0       1       0

        var bp = [];
        bp.push({
            x: ((-p[0].x + 6 * p[1].x + p[2].x) / 6),
            y: ((-p[0].y + 6 * p[1].y + p[2].y) / 6)
        });
        bp.push({
            x: ((p[1].x + 6 * p[2].x - p[3].x) / 6),
            y: ((p[1].y + 6 * p[2].y - p[3].y) / 6)
        });
        bp.push({
            x: p[2].x,
            y: p[2].y
        });
        result.push(bp);
    }

    return result;
}
It gives back an array where each item is an array of 3 points. These are the control points we'll use to construct the path.
Constructing the path
We need to construct the path using the control points we got back from the converter. First, we need to move to the start point, then we just draw the curves.
function makePath(points) {
    var result = "M" + points[0].x + "," + points[0].y + " ";
    var catmull = catmullRom2bezier(points);
    for (var i = 0; i < catmull.length; i++) {
        result += "C" + catmull[i][0].x + "," + catmull[i][0].y + " " + catmull[i][1].x + "," + catmull[i][1].y + " " + catmull[i][2].x + "," + catmull[i][2].y + " ";
    }
    return result;
}
This function gives back the string for the path, ready to use.
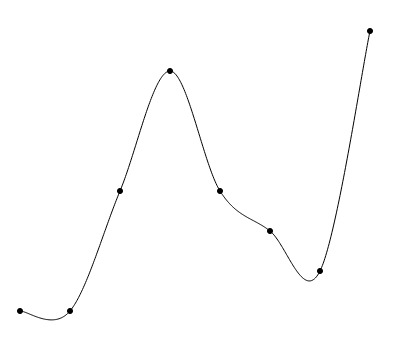
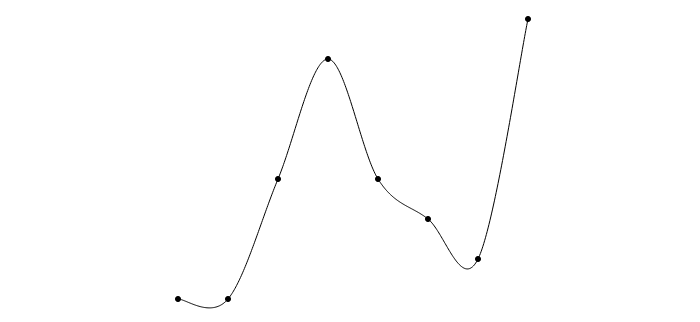
Full example
First, we need an index.html:
<html>
	<head>
		<script src="test.js"></script>
	</head>
	<body>
		<svg height="400" width="400" id="svg">
			<path fill="none" stroke="black" />
		</svg>
	</body>
</html>
And a test.js:
function catmullRom2bezier(points) {
    var result = [];
    for (var i = 0; i < points.length - 1; i++) {
        var p = [];

        p.push({
            x: points[Math.max(i - 1, 0)].x,
            y: points[Math.max(i - 1, 0)].y
        });
        p.push({
            x: points[i].x,
            y: points[i].y
        });
        p.push({
            x: points[i + 1].x,
            y: points[i + 1].y
        });
        p.push({
            x: points[Math.min(i + 2, points.length - 1)].x,
            y: points[Math.min(i + 2, points.length - 1)].y
        });

        // Catmull-Rom to Cubic Bezier conversion matrix
        //    0       1       0       0
        //  -1/6      1      1/6      0
        //    0      1/6      1     -1/6
        //    0       0       1       0

        var bp = [];
        bp.push({
            x: ((-p[0].x + 6 * p[1].x + p[2].x) / 6),
            y: ((-p[0].y + 6 * p[1].y + p[2].y) / 6)
        });
        bp.push({
            x: ((p[1].x + 6 * p[2].x - p[3].x) / 6),
            y: ((p[1].y + 6 * p[2].y - p[3].y) / 6)
        });
        bp.push({
            x: p[2].x,
            y: p[2].y
        });
        result.push(bp);
    }

    return result;
}

function makePath(points) {
    var result = "M" + points[0].x + "," + points[0].y + " ";
    var catmull = catmullRom2bezier(points);
    for (var i = 0; i < catmull.length; i++) {
        result += "C" + catmull[i][0].x + "," + catmull[i][0].y + " " + catmull[i][1].x + "," + catmull[i][1].y + " " + catmull[i][2].x + "," + catmull[i][2].y + " ";
    }
    return result;
}

window.onload = function () {
    var graph = [2, 2, 5, 8, 5, 4, 3, 9];
    var points = [];
    for (var i = 0; i < graph.length; i++) {
        points.push({x: i * 50 + 20, y: graph[i] * 40 * -1 + 400});
    }
    document.querySelector('#svg path').setAttribute('d', makePath(points));
    for (var i = 0; i < points.length; i++) {
        var circle = points[i];
        var c = document.createElementNS("http://www.w3.org/2000/svg", "circle");
        c.setAttribute("cx", circle.x);
        c.setAttribute("cy", circle.y);
        c.setAttribute("r", "3");
        document.querySelector('#svg').appendChild(c);
    }
};
This draws a nice looking chart, like this: