
AWS security case study: Unprotected logs
How a simple oversight can lead to information exposure


In this case study, we'll look into a security problem that is the result of an often overlooked problem that can leak sensitive information.
There is a Lambda function that an external system invokes. These calls involve passing sensitive information between the systems. There is also a malicious user with limited read access to the account.
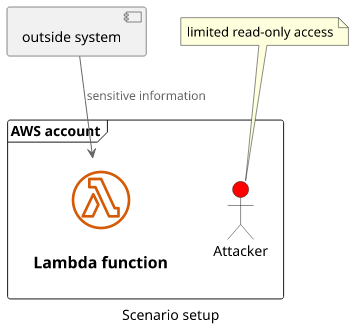
The target is the sensitive data that is passed to the Lambda function.
This setup can be secured, but due to a bug it's possible to extract the secret information in this example scenario.

Setup the environment
If you want to follow along with this article you can deploy this scenario with Terraform. It sets up everything for you and outputs all resources/data you'll need. The CLI examples are for Linux, but I'm reasonably sure that they work on MacOS, and probably on Windows too.
To deploy the architecture, download the code from the GitHub repository, initialize with terraform init and deploy with terraform apply.
The module outputs the important bits:
- The ARN of the Lambda function
- The credentials for the IAM user
$ terraform output
access_key_id = "AKIAUB3O2IQ5IDDSJCGO"
lambda_arn = "arn:aws:lambda:eu-central-1:278868411450:function:function-79044b4f2af90c6e"
secret_access_key = <sensitive>
(Don't forget to clean up when you are done with terraform destroy)
To emulate an environment where you are logged in as the user, start a new shell with the credentials set:
AWS_ACCESS_KEY_ID=$(terraform output -raw access_key_id) \
	AWS_SECRET_ACCESS_KEY=$(terraform output -raw secret_access_key) \
	AWS_SESSION_TOKEN="" bash
All AWS CLI commands will be run with that user set:
$ aws sts get-caller-identity{
"UserId": "AIDAUB3O2IQ5I2JOTINHK",
"Account": "278868411450",
"Arn": "arn:aws:iam::278868411450:user/user-79044b4f2af90c6e"
}The attack
First, let's extract the Lambda function name from its ARN as we'll need that in subsequent commands. The documentation describes the format of the ARN for a Lambda function:
arn:${Partition}:lambda:${Region}:${Account}:function:${FunctionName}The last part is the function name, so get only that and store it in a variable:
$ FUNCTION_NAME=$(terraform output -raw lambda_arn | grep -Po '(?<=:function:).*$')
$ echo $FUNCTION_NAME
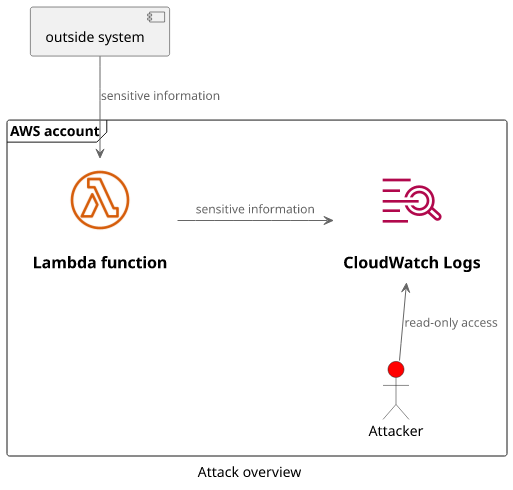
function-79044b4f2af90c6eA Lambda function automatically sends all console output to CloudWatch Logs. The structure of logging has 2 levels: log groups and log streams.
Log groups are per Lambda function and each function has a dedicated log group with the name /aws/lambda/$FUNCTION_NAME. With the lambda function's name
and some read-only permissions the user can query the log streams for the function's log group:
aws logs describe-log-streams --log-group-name /aws/lambda/$FUNCTION_NAME{
"logStreams": [
{
"logStreamName": "2021/07/29/[$LATEST]fdecc1fbcce848a99104f213b23cf509",
"creationTime": 1627540759606,
"firstEventTimestamp": 1627540757637,
"lastEventTimestamp": 1627540996334,
"lastIngestionTime": 1627542505197,
"uploadSequenceToken": "49620389824351474004874948260846968469479601671422353186",
"arn": "arn:aws:logs:eu-central-1:2...",
"storedBytes": 0
}
]
}This gives back a list of log streams, which are containers for instances of the running function. The currently used log stream is usually changed with a new function version and when the Lambda service decides to start another instance. In this case, there is only one log stream, but it's fairly easy to decide which one is active based on the timestamps.
Let's store its name in a variable as we'll need that in the next step:
$ LOG_STREAM_NAME=$(aws logs describe-log-streams \
	--log-group-name /aws/lambda/$FUNCTION_NAME \
	| jq -r '.logStreams[0].logStreamName')
Log streams contain log messages, called log events. To get them, we'll need the log group name and the log stream name:
$ aws logs get-log-events --log-group-name /aws/lambda/$FUNCTION_NAME --log-stream-name $LOG_STREAM_NAME{
"events": [
{
"timestamp": 1627540757637,
"message": "START RequestId: 564b1613-6321-4491-aae5-c96eebbf92c9 Version: $LATEST\n",
"ingestionTime": 1627540759613
},
{
"timestamp": 1627540757651,
"message": "2021-07-29T06:39:17.650Z\t564b1613-6321-4491-aae5-c96eebbf92c9\tINFO\t{\"secret\":\"GY8ftFQhNyoMKjF534rEu9yQXXPQ2kQh+g7hbZpkpM8=\"}\n",
"ingestionTime": 1627540759613
},
{
"timestamp": 1627540757652,
"message": "END RequestId: 564b1613-6321-4491-aae5-c96eebbf92c9\n",
"ingestionTime": 1627540759613
},
{
"timestamp": 1627540757652,
"message": "REPORT RequestId: 564b1613-6321-4491-aae5-c96eebbf92c9\tDuration: 14.79 ms\tBilled Duration: 15 ms\tMemory Size: 128 MB\tMax Memory Used: 65 MB\tInit Duration: 136.26 ms\t\n",
"ingestionTime": 1627540759613
},
"..."
]
}The Lambda service automatically inserts log messages for every invocation. These are the START, END, and REPORT messages. But the second
message is logged by the Lambda code itself and it contains the secret value received from the outside system.
To reduce the clutter, it's easy to use grep and jq to show only these values:
$ aws logs get-log-events \
	--log-group-name /aws/lambda/$FUNCTION_NAME \
	--log-stream-name $LOG_STREAM_NAME \
	| jq -r '.events[].message' | grep -o '\{[^}]*\}' | jq -r '.secret'
sHJaqvN8DsPQAH7ev5ANbItBdkD9/E35gy3ntYdcr/w=
e+B4kjwWhj3TUckxSfhvhpNqbe1zTeAcMEm3BhbYei8=
Yu7Je9NXfIf6/UhiKWkBR2PHhtz7auVOqAbVHVwKNus=
u7zkz2ul+0jLM+HB8c0ZxCtwJc/ULoTaVfkXcyoWswc=
9Dqsf9VobwEJ40gkafu0X6ISwBZntVmpz3lEskmXDiQ=
ROKtVVKTG5vS5erifNvOEOFVeIXQvg0dTFXCI5V0Uik=
djTXbvLroyKy9qO6WZtqpXjJXbfcxsMMBtA5jlLlyEc=
G01AUWg/vL0eyNGiFoUVWaxE0WWI47z0lcEXXzIgHv0=
FCKEcGyW+8hJHTYMNnFFBw7FGBU9OpiXB3MaAvmsELA=
LInF4sev22kYq83jHLxQtAstp1+DTYl3UNgBOPpyOVE=
Aw94KlqKnBqMTvLxnRlHMLU1MhZ9XP71oM23Fv1R6hk=
tLUnws8lc9DBu7isrd7Puu+hRSqsfARdH1wV1/tHZpc=
ROLewznsvboW2LoZ3rDiipqFP9JgsjEbVqZrs1g81mU=
cgKHurTURYkeS8GfOQ6DzJxD+g3T0zia1cBussGKNn4=Analysis
By itself, a Lambda function won't put sensitive information into the logs. The reason why in this case the secret value ends up there is an oversight in the handler code:
module.exports.handler = async (event, context) => {
	console.log(JSON.stringify(event));

	// do some magic ...

	return "OK";
};
Notice the console.log statement with the event object. This prints the invocation's payload to the console that is forwarded and stored in CloudWatch
Logs automatically by the Lambda service.
This seems like a trivial oversight but it's a surprisingly common mistake. When a Lambda function runs it's a black box and to gain visibility into what
happens inside, using console.log is the easiest solution. Because of this, developers of these functions usually insert quite a few of such debug logs
and these can easily end up in the production system. And these logs are usually way less secure than the databases the data is intended to be stored.
When it happens, it's known as the Insertion of Sensitive Information into Log File security vulnerability. And it happens. Twitter had an incident when it had to reset the user passwords because they were put into a log file without hashing. In another incident, the administrator password was stored in the logs in plain text.
How to fix it
This is a hard problem to fix. Logging is a requirement even for a production system and it's essential during development, so simply banning all console.
statements is not a good solution here. On the other hand, it's hard to notice when sensitive information ends up in the logs.
The first step to take is to secure the logs. If you don't allow access to a database you don't want that identity to read the logs. Make sure to limit access to the logs service via IAM policies.
Second, don't log sensitive information, but it's easier said than done. It's a good idea to manually check the logs from time to time, and might be possible to search for patterns that might indicate sensitive information, such as something that looks like a credit card number or a password.
Third, you can configure different log levels for different environments. If the logs are to aid development, they can use a "debug" log level and the production system can simply ignore these commands. This is a bit more involved, but there are frameworks to help with this.
It's imporant to not hash the sensitive information in the logs. Unfortunately, this practice is recommended in some places and it "looks secure", but it's just security theater (looks effective but doesn't improve security). Hashing is a one-way operation only when the input data has sufficient entropy. If you hash a phone number or a date of birth, it's easy to try all possible values and see which one matches the hash in the log, thus revealing the sensitive information.
Lessons learned
- The Lambda service automatically sends its logs to CloudWatch Logs
- Each Lambda function has a dedicated log group and named
/aws/lambda/<function name> - If a function uses
console.logwith sensitive information, it exposes this data to anyone who has read access to the logs