Effective debugging with breakpoints
Know how to use the developer's Swiss Army knife

Previously in this tutorial series, we discussed manual verification and print debugging as possible approaches to problem-solving. Those techniques can provide the necessary insight in many cases, but they can also be very limiting when you have to understand the inner flow of a complex program or framework you are not familiar with.
Today, I'd like to discuss interactive debugging, that can be a great help in these cases.
This process introduces an additional dependency to the development flow compared to the simple compile-run-manual check cycles, as it requires a debug connection to the application. While remote debugging is possible in most stacks, the typical use case is to do it locally with an IDE.
In order to use it, you have to:
- deploy breakpoints to stop program execution at specific lines of code
- and investigate the internal state of the program when it is paused.
Each of these steps can be done in multiple ways depending on your concrete use-case, so let's dive a little bit deeper into the details.
Stop the world with Breakpoints
The breakpoints can be deployed anytime, even in the middle of an already started debugging session. You can start the program before or after you deploy the breakpoints, and you can even add more breakpoints while investigating an already paused program.
There are multiple types of breakpoints you can use. The most commonly used unconditional breakpoint always stops the execution when it's hit. This breakpoint can be deployed in a single click on the sidebar. It's frequently used, as it's simple and typically provide everything you need to zoom into any line of code.
While it's mostly fine, sometimes it can be limiting that it stops the execution every time. This is OK if the method in question is called only once, or you don't care about which execution you inspect.
Conditional breakpoints
Consider the following program that calculates the geometric mean of scores for the given movies.
double geometricMeanOfRatings(List<Movie> movies) {
	double product = 1;
	for (Movie movie : movies) {
		product *= movie.getRating().score;
	}
	return Math.pow(product, 1D / movies.size());
}
Usually, it works well, but imagine one day it starts to behave oddly: it returns 0 all the time. Placing a simple
breakpoint at the return statement reveals that it returns zero because the value of the product variable
is 0.0. It's possible if the rating is 0 for at least one movie. But which movie is it? Placing an unconditional
breakpoint inside the for loop would needlessly make the program stop for many times. (Consider hundreds of movies.)
The solution is to specify a movie.getRating().score == 0 condition for the breakpoint, that stops
right at the bogus movie.
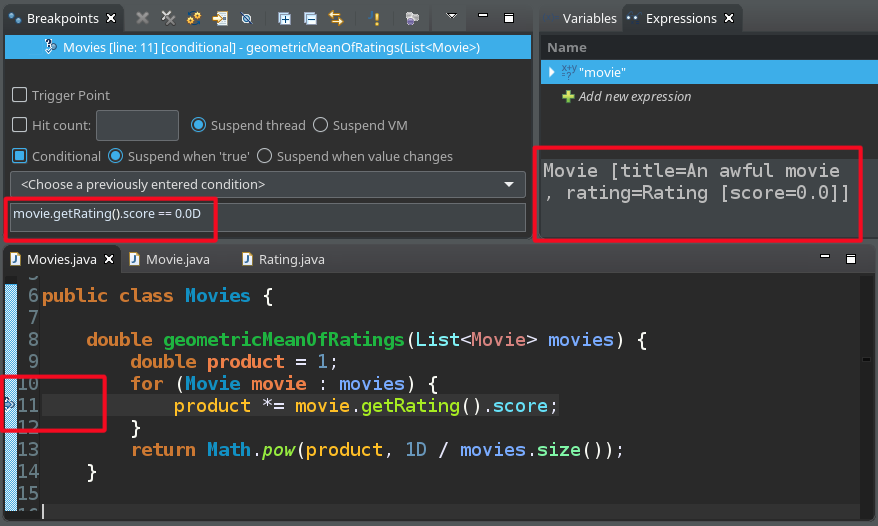
Conditional breakpoints are breakpoints parameterized to trigger only when certain criteria are met. The condition can be specified in the host language, making it really flexible.
Tracepoints
The breakpoint conditions don't have to be simple statements like x == 42 all the time. They can have many lines of code that will be executed as if they were part of the program. Tracepoints are one example of using "clever" conditions, where the condition is to execute a log statement and return false. They never suspend the running program, just print a debug message to the standard output.
Many IDEs have support for Tracepoints, making them easy to deploy. In Eclipse, you can toggle them with Alt+t.
The Tracepoints are generated to System.out.println the name of the method they are placed in, but this can be
configured.
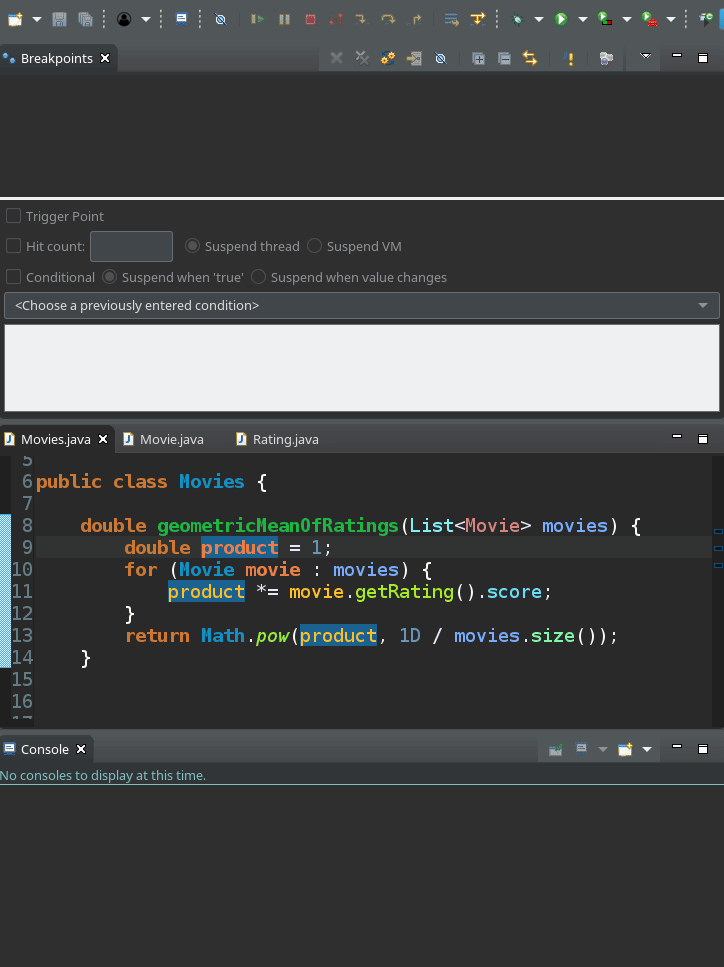
You can think of Tracepoints as some sort of ephemeral log statements, with a lifetime limited to the debugging session.
It's worth checking out the details in the breakpoint properties window because there are multiple ways to fine-tune breakpoint conditions, for example:
- you can pause at breakpoints only after another specific breakpoint was reached
- you can automatically disable a breakpoint after it's been hit for n times
Event-based breakpoints
Certain breakpoints are tied to events, rather than deployed to a specific line of code. For example, you can pause the
execution when an exception is thrown anywhere in the application with Exception Breakpoints. In the movies example,
it can be handy if the geometricMeanOfRatingsmethod starts to throw NullPointerExceptions,
and you are keen to find the Movie object for which the getRating returns null instead of a real value.
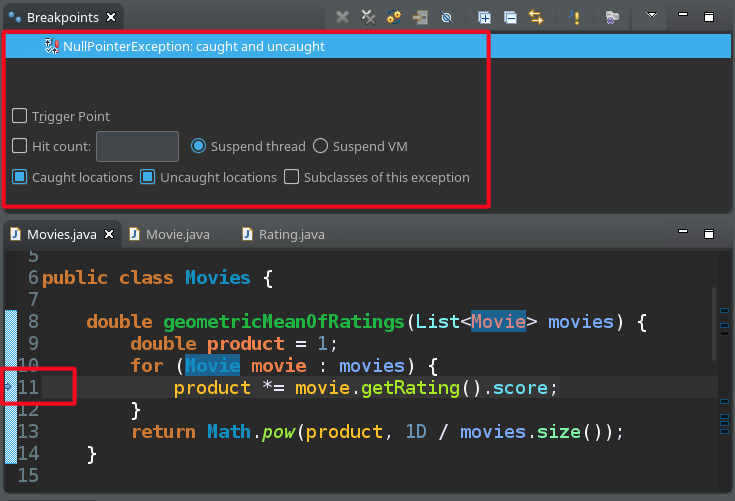
Another type of event-based breakpoints is the Watchpoint, which can be used to stop the program when a given field is accessed or modified.
Examine the application when it's stopped
A breakpoint can stop the current thread or the whole virtual machine depending on its configuration. Usually, this isn't something that you should keep an eye on, but it can make a difference in multithreaded environments, such as web applications. Or, when you remote-debug an application used by other developers. In case of Java, by default Eclipse suspends the thread that hit the breakpoint while IntelliJ IDEA suspends the whole JVM.
The values of variables and fields from the current and parent scopes when the program is paused are accessible. Usually, there is a dedicated Variables view that summarizes them, but you can check the value of each one by simply hovering over it with the mouse.
You can see them change if you continue the execution step-by-step, one line at a time.
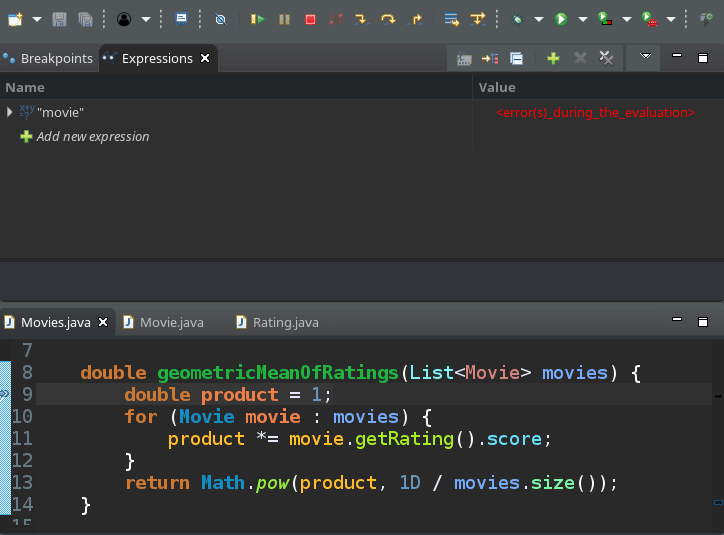
Or, you can continue the whole program, to run until it hits the next breakpoint when you can inspect the variables again. I do this quite often when I need to investigate values on two distinct parts of the execution. It's well worth to memorize the keyboard shortcuts for the most commonly used debugging actions, so you can pay attention to the code you debug rather than the quirks of your IDE.
String representation and internal structure
It's important to note, that generally the values are rendered by the object's toString method, so it's always a good practice to define them carefully.
If you use IntelliJ (or Chrome if you debug Javascript) you can see the values of the variables printed for each line as comments. While it does not print a lot of potentially interesting data, usually it's more than enough to see the result of an assignment.

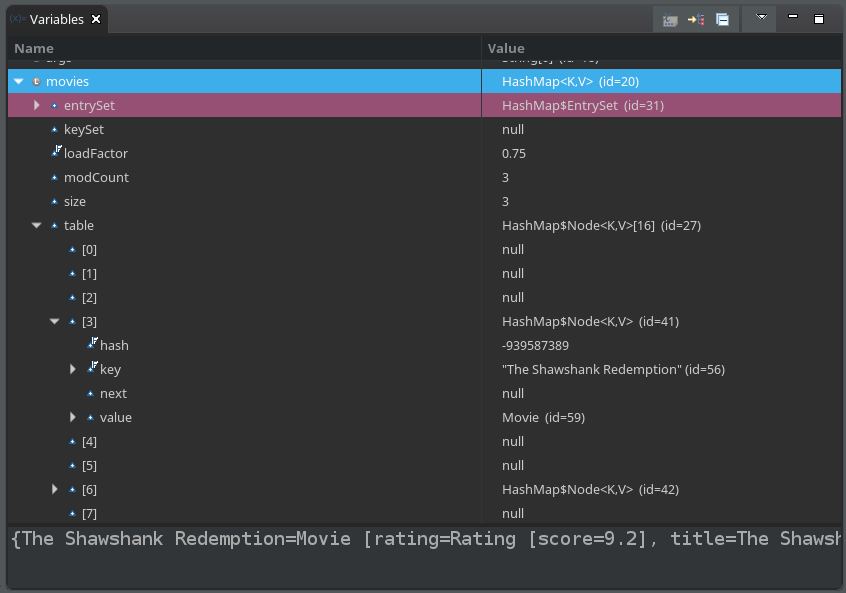
Besides the toString version of the object, you can also check it's internal structure.
This is (by definition) tightly coupled with internal details of the implementation, so it's not always the most
convenient way to get information. For example, the next image illustrates how the data in a HashMap looks like:
Luckily, there is a neat feature in Eclipse called Show logical structure
that allows to view objects in another, more meaningful structure. It can be configured manually, but
it also comes with handy defaults for commonly used data types. Let's see how the HashMap is doing
with show logical structure enabled:
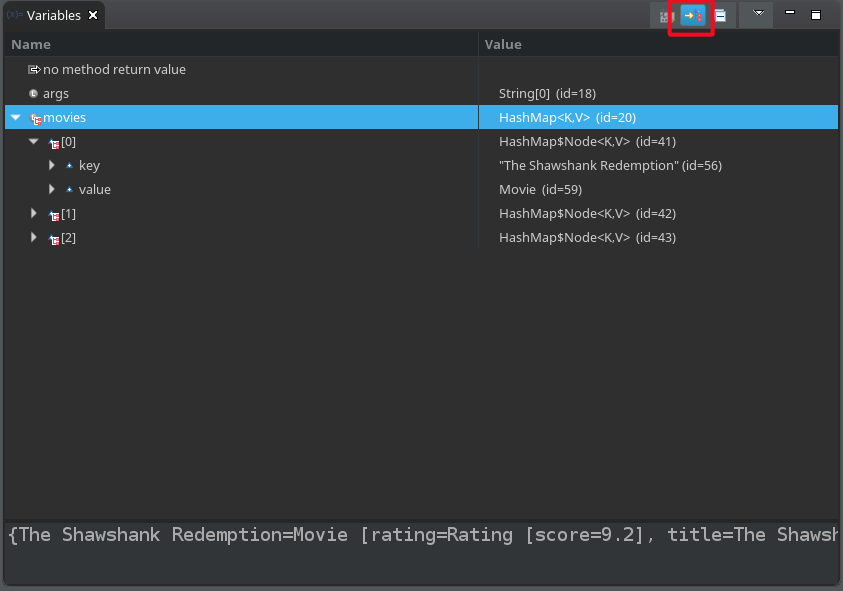
The difference in information density is pretty clear. If you find yourself clicking too much in the variable view looking for something in the nested structures, consider defining a saner logical structure presentation for them.
Changing the values of variables and fields
IDEs allow not only to inspect but to change variables and fields on the fly. This can be handy for a number of reasons. Imagine you've posted a web form, and now inspecting the processing logic on the server application. A few if-statements deep in the code you realize that you forgot to set a field to the desired value. Now a different code path is going to be executed. In this case, changing the value of the field while debugging can save you some time.
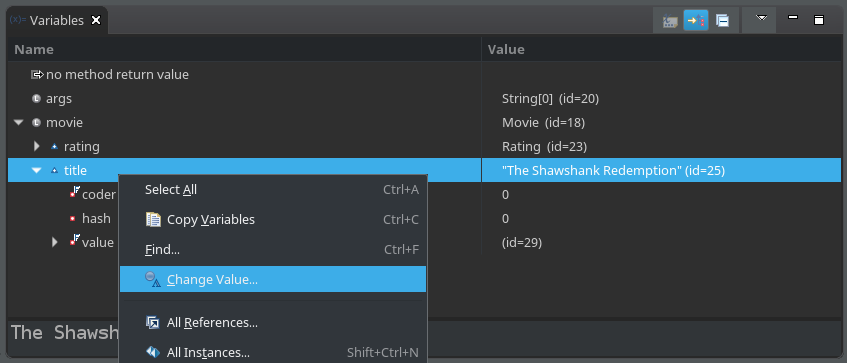
On top of that, you can execute arbitrary code at any given point in time. This is really cool because you can query APIs and experiment with the results. If the method you experiment with has no side effects, then it's even better, as you can try it as many times as you'd like, and it does not corrupt the following executions. I really like how easy it is to debug functional style code.
You can run these experiments, in multiple ways, depending on your needs.
- The simplest thing you can do is simply select the piece of code you'd like to run, right click, then Inspect. It will display the result of the evaluation in a popup.
- If you try to run a piece of code very often, you are better off with watch expressions. This is a persistent list of expressions that are evaluated whenever the debugger stops the program.
- If you need to draft some code and run some part of it, there are sketch boards in most IDEs. For example, in Eclipse the Display view serves this purpose.
Step filters
While stepping through the codebase I often find myself wandering in the bowels of frameworks and libraries that my application depends on. (This is quite frequent if I keep pressing Step into.) I am usually not that interested in their internals - first I want to debug the code that I wrote.
Luckily there is an option to use Step Filtering in Eclipse. (I did not find a similar feature in IntelliJ for Java.)
With this feature, one can configure which packages to skip when stepping through the code. The list of packages
can be configured in the Java > Debug > Step filtering menu. The filtering behavior can be toggled with
the Use Step Filters (Shift+F5) button.
Drop to frame
Another interesting feature I've found both in Eclipse and IntelliJ is Drop to frame. This command allows re-entering the selected stack frame. It essentially enables to replay every instruction from a given point. This can be helpful to go back to the start of a method if you missed something you'd like to see.
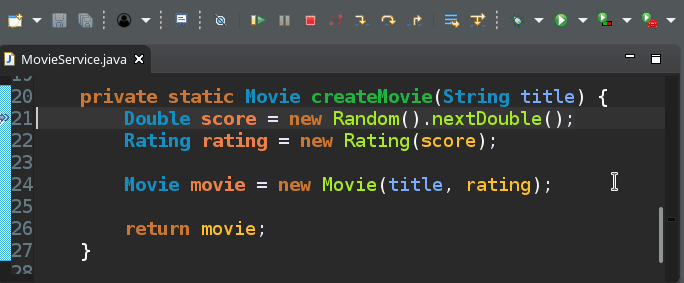
This is not time travelling in the sense that the previous changes to the global state will not disappear. So keep in mind that the execution might take a different path on the second try.
As you can see, debugging is a very flexible tool, there are many ways to stop and inspect an application. In the next sections, I try to collect some ideas about when it's a good idea to use it.
Pro
Debugging is the Swiss Army knife of a developer. Breakpoints are excellent tools to query internal state or to call APIs at a given point of the code. With dynamic code evaluation, a method or function can be easily called with the relevant input data to investigate its results.
You don't have to restart the application to toggle breakpoints or to do new kinds of investigations, you can also change your debugging strategy while in a middle of a debugging session.
Also, if you don't exactly know what you are looking for, you can easily inspect all variables and methods available from the given line of code. It's really useful when working with new code or large codebases.
Tracepoints provide the benefits of logging, but it does not require to restart the application after adding a log statement. Toggling tracepoints in your IDE is all you need to adjust what is visible on the console. This also means that you don't have to clutter your code with print statements using this technique.
Con
Typically it's most feasible to use breakpoints in local debugging sessions only, and it requires manual intervention to interrogate the system under debugging to get the relevant data each time the program stops at a breakpoint. This two makes really hard to catch sporadic events happening over a long time.
Because the system has to be manually poked each time, it does not scale well. If you debug something today, then tomorrow you can't depend on this knowledge as the system might behave completely differently. If you have to modify a complex application with a lot of desired properties and internal invariants, you might quickly get overwhelmed by the many little details you have to keep an eye on every time you modify something. In this case writing some tests might be a better alternative, as they can be executed repeatedly, without much effort, and they are much better at locking down desired behaviors of the software.
Debugging is a flexible tool. Because you can debug pretty much everything, relying excessively on this technique does not reward carefully planned design. It's so powerful that it allows to succeed with very bad designs for a while, but it limits the ability to involve new developers. In the end, it might result in harder to maintain systems that only those can touch effectively who knows all their internal details.
I am not saying debugging is evil, but don't overuse it. Try to split the complex logic into isolated units, write unit tests for them, and avoid global state if you can.
Robert C. Martin shares similar views about debuggers. The following quote is from his post Debuggers are a wasteful Timesink from 2003:
I consider debuggers to be a drug -- an addiction. Programmers can get into the horrible habit of depending on the debugger instead of on their brain. IMHO a debugger is a tool of last resort. Once you have exhausted every other avenue of diagnosis, and have given very careful thought to just rewriting the offending code, then you may need a debugger.
I know this comment is a bit old, but I hear similar arguments often, and I think it has truth in it.
Summary
Debugging is a powerful tool with a lot of capabilities. I think it's essential for any developer to learn to use it effectively. With the growing number of frameworks and libraries, it's essential to be able to take a peek under the hood. However, try not to debug too much, and don't rely solely on the ability that you can step through the whole codebase once you get familiar with it.


