
Lambda development toolbox: CLI logs watcher
Easily see Lambda errors in the console with a one-liner script

 An npm package is available
Debugging Lambda functions
When I deploy a Lambda function behind an API Gateway, about 8 out of 10 times after opening it in a browser I see this:
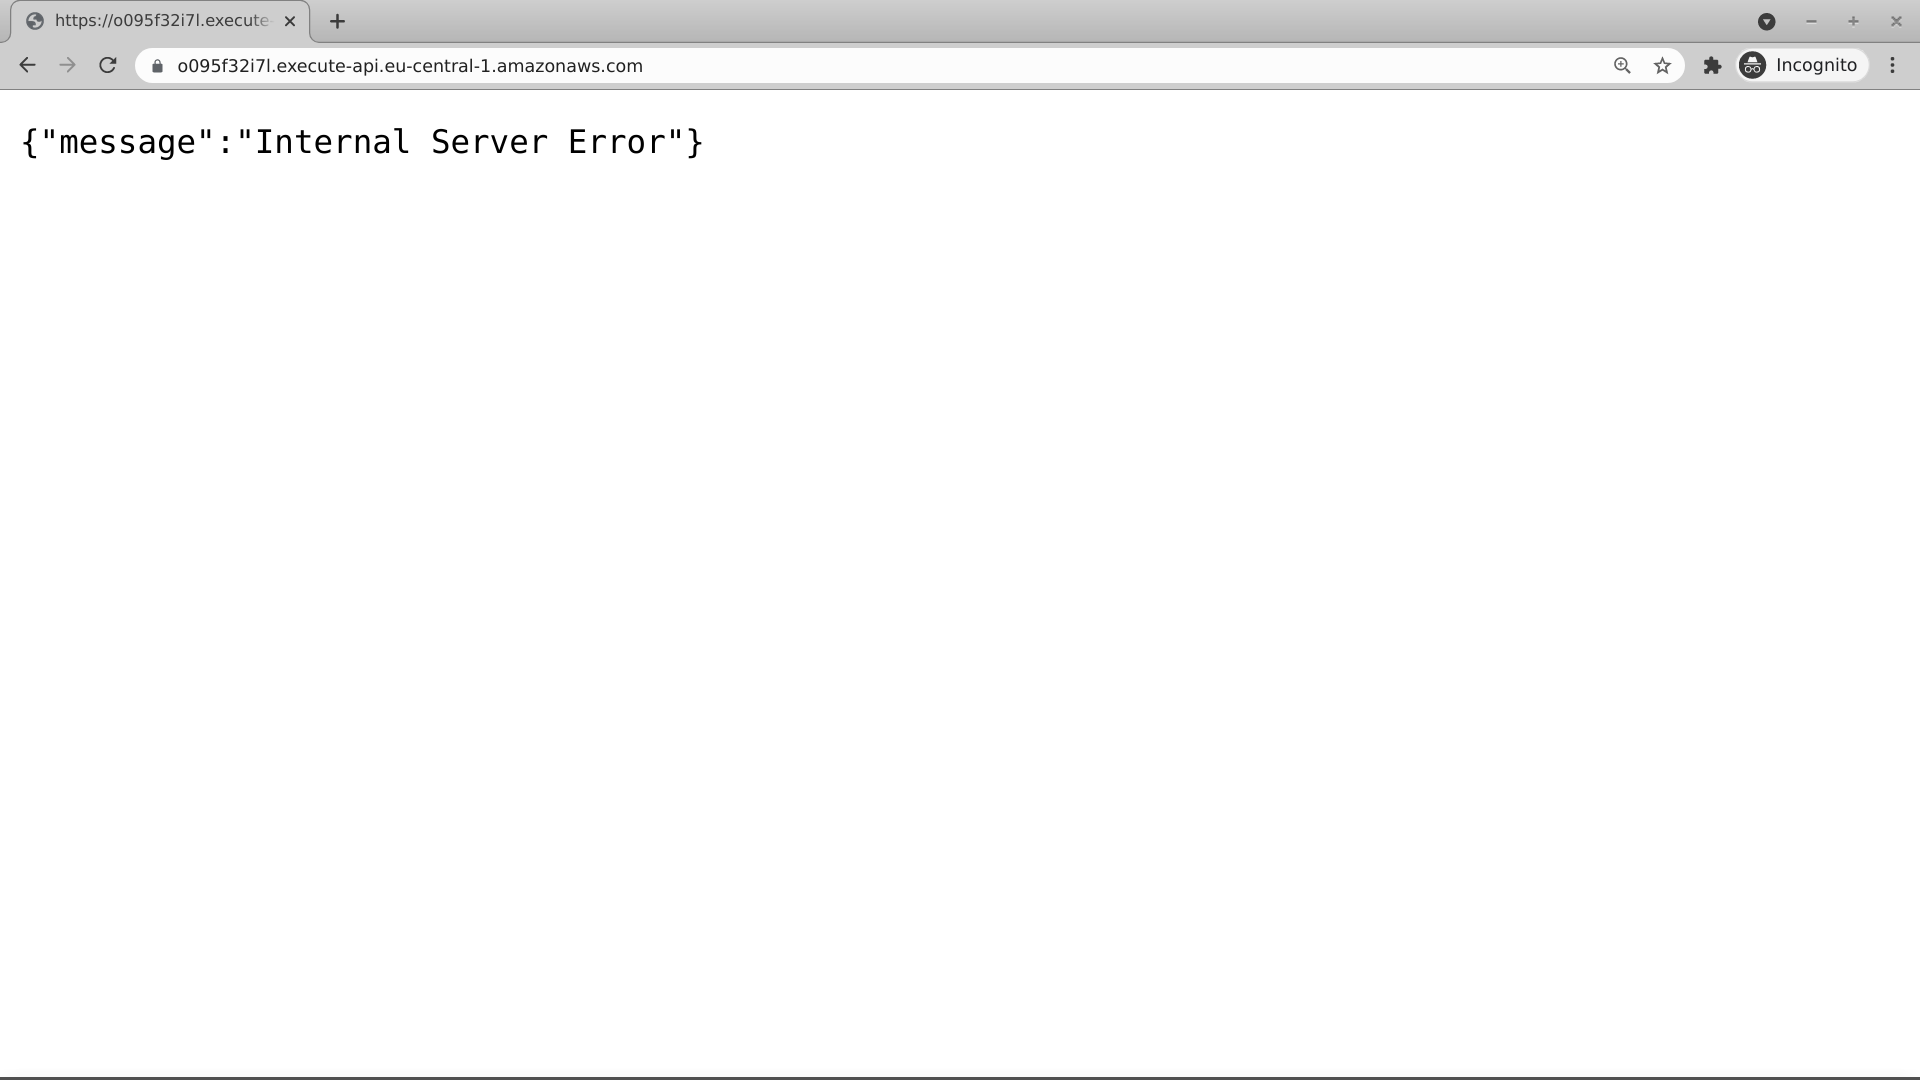
This means that the Lambda function threw an error and the API Gateway can not produce a response to the HTTP request. Since a Lambda function can contain arbitrary code and there can be configuration issues, many things can go wrong.
The easiest way to debug what happened is to look at the Lambda logs in CloudWatch Logs:
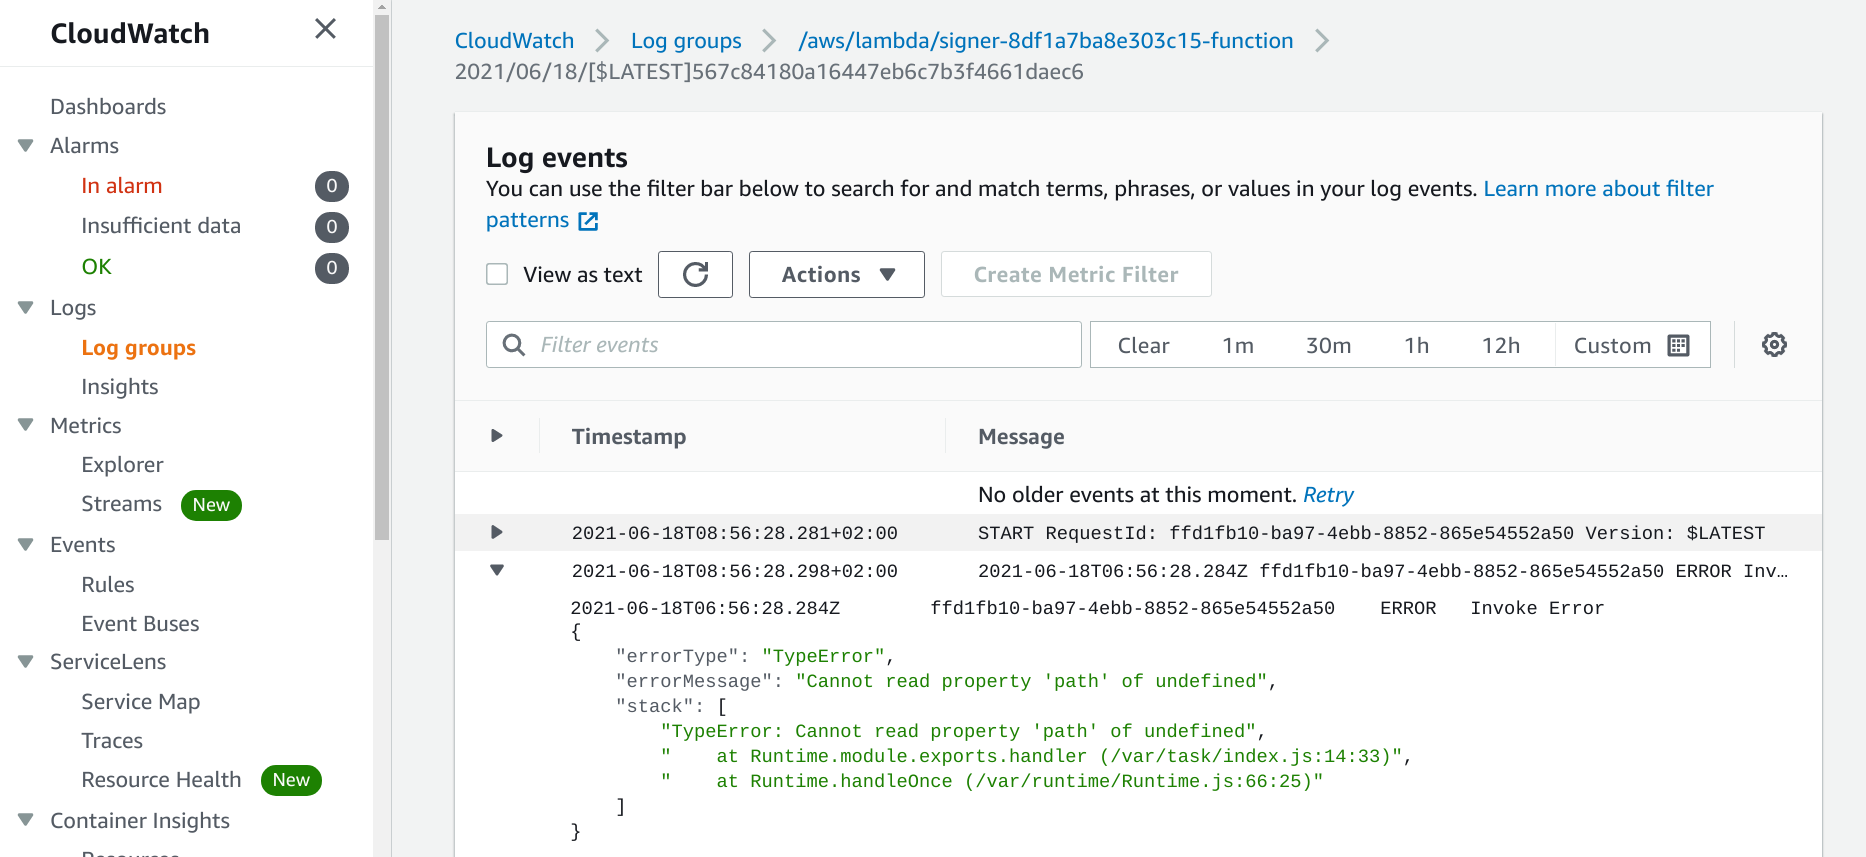
The error is there, pointing to a typo. Great, I can then go to the Lambda code, fix the error, and redeploy. But chances are, I still see the same "Internal Server Error" message. Then I need to go to the log groups, find the new log stream, and find the new error in that stream as a new version logs to a new stream:
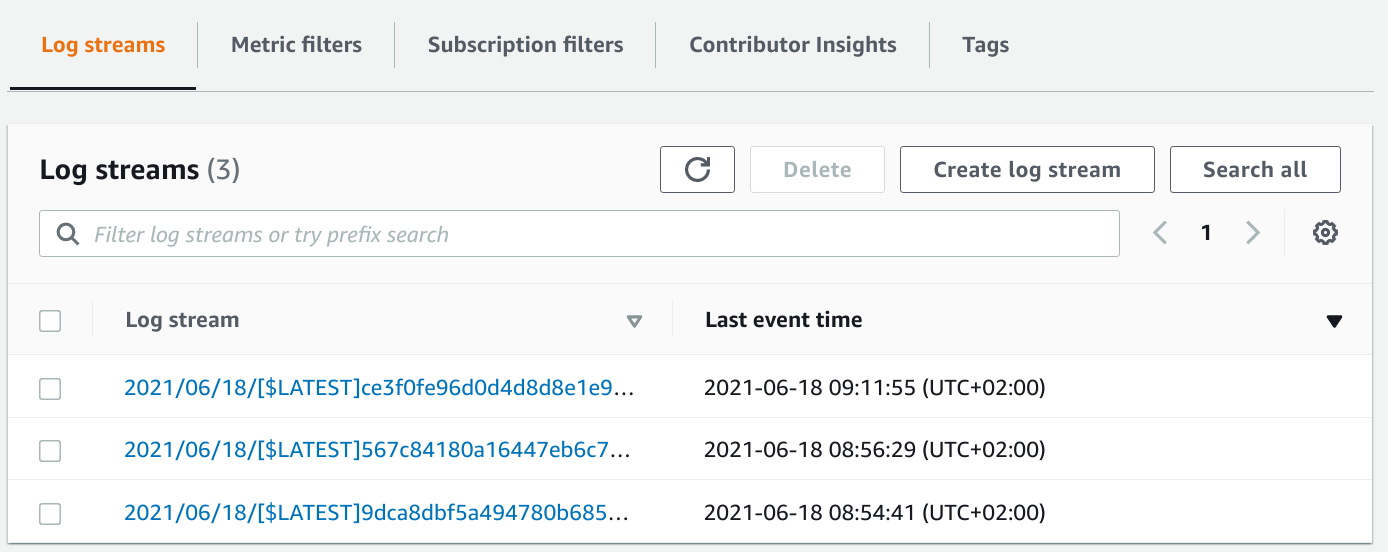
This is a frustrating process and it breaks the development flow with a lot of unnecessary clicking. Even though the Console tries to be helpful by having a button that goes to the correct log group from the Lambda function, every error message means I need to navigate the CloudWatch Logs console.
I used a bash script to automate this process, but even that was too much as I needed to add an extra file to the project.

This prompted me to make an easy-to-remember command to watch the latest version of the Lambda logs automatically.

npx watch-lambda-logs
It is a simple NodeJs script that finds the log group for the function, then gets the log stream with the latest event time. Then it lists the last messages and prints them to the console. Then repeat it every 2 seconds.
To use it:
npx watch-lambda-logsWith it, you don't need to sign in to the Console and find the Lambda logs. Just invoke the function (or send a request via API Gateway) and in a few seconds you'll see all the errors.
Arguments
You can specify a function name or an ARN to watch. Just add them after the command:
npx watch-lambda-logs my-functionTerraform support
If there is a Terraform state file in the directory the script reads the managed functions from it. If there is only one and you didn't specify a function name or ARN in the command then it will automatically watch that.
And when there are multiple functions managed by Terraform then you can choose which one to watch:
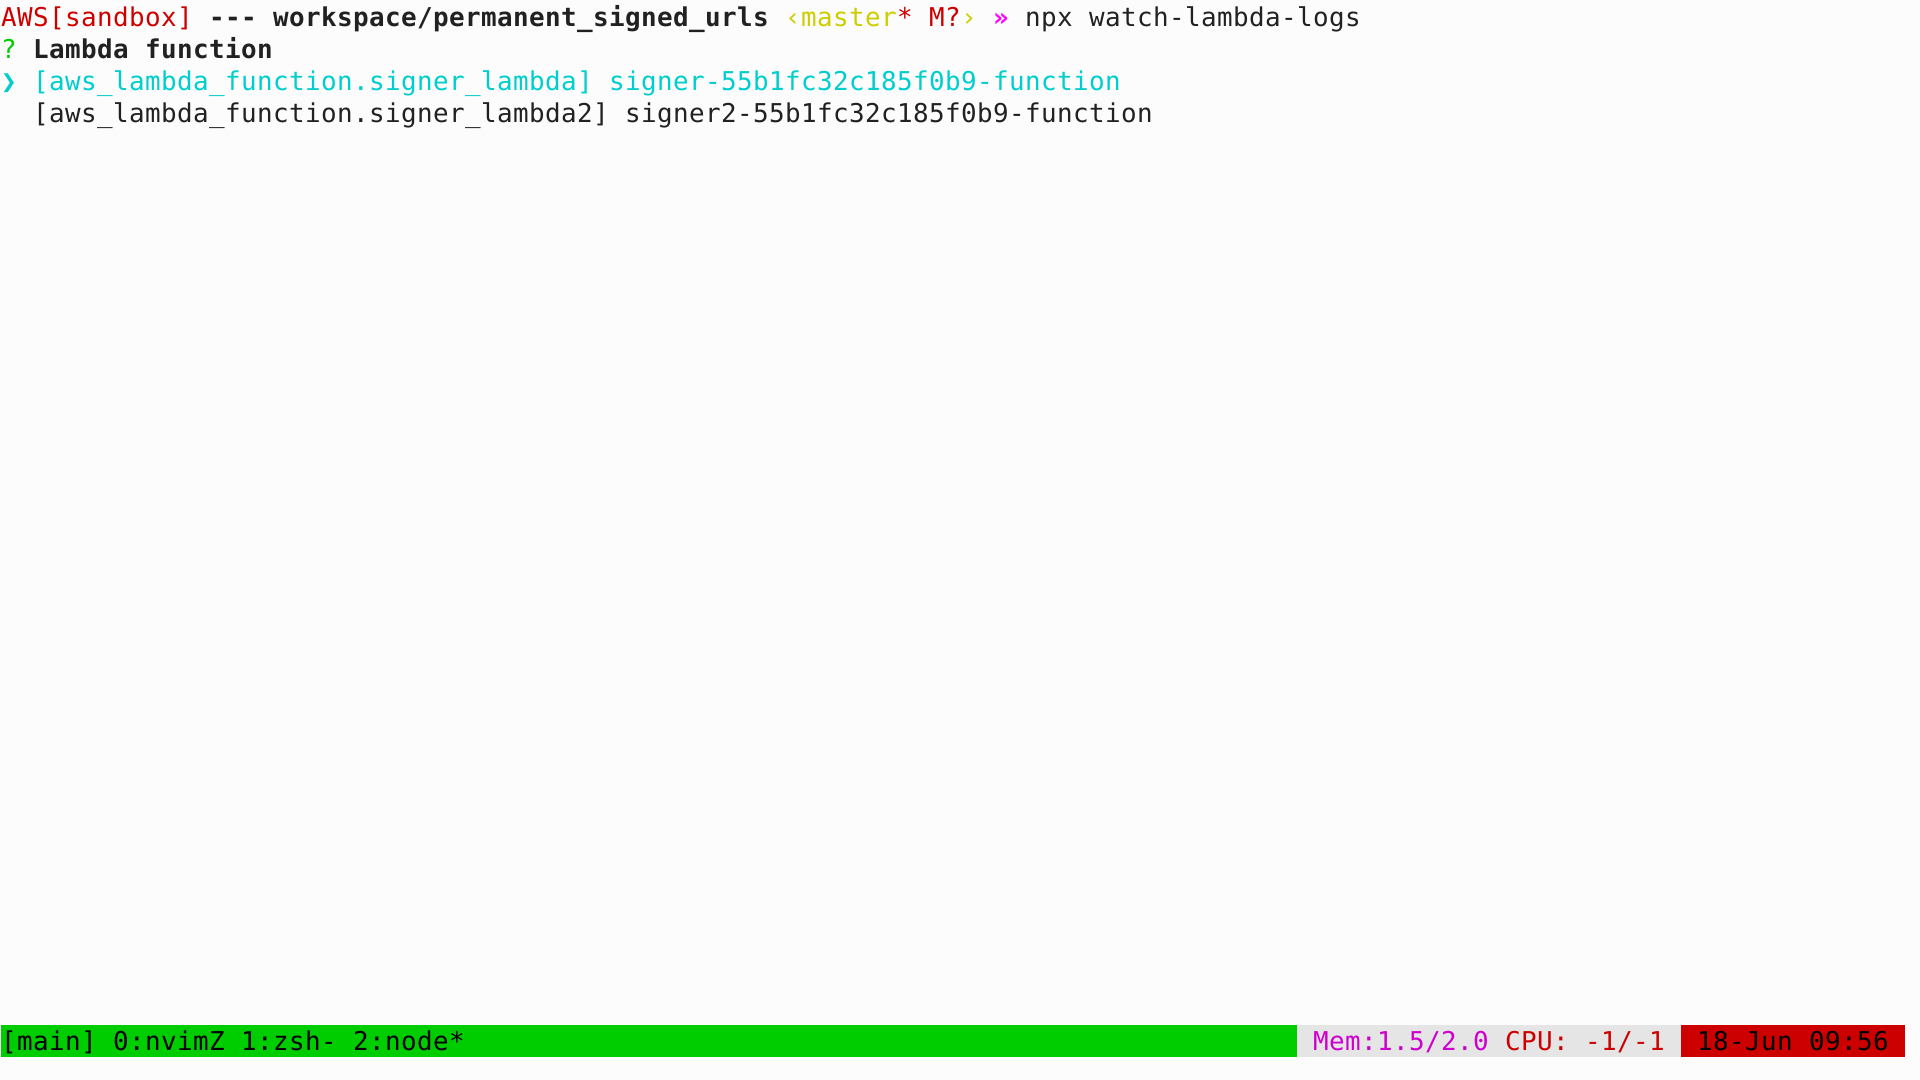
Demo video
Here's a demo video of how the script helps rapidly debug Lambda errors:
You can see how it helps to fix problems:
- The browser returns an "Internal Server Error", and the watcher shows the error message
- Updating the code and refreshing the browser shows another error, and the watcher automatically switches to the new log stream and shows the new error message
- Fixing the second problem shows that the function works correctly